{quote} Never sat at the top table So did not have to pay anything
Ignored
There is No top table that I am aware of, we are all mostly amateur aspring traders with a few pro's visiting now & again to keep us in order and offer
advice, it's really up to us, whether we listen to them or the Beatles.
{quote} Normally a pint of your blood, but we waived that for you.
Ignored
Shabs
That's a good one
Its a very real and (sore) subject for me and I can assure you, maybe not your gang, but someone else recieved a gift of a lot more than a pint
{quote} Shabs That's a good one Its a very real and (sore) subject for me and I can assure you, maybe not your gang, but someone else recieved a gift of a lot more than a pint
Ignored
I'm just joking of course, my wierd sense of humour.
What you just said is really disturbing to hear.
It's nobodys gang, we are all individuals letting off some air, having fun and occasionally talk Forex Charts.
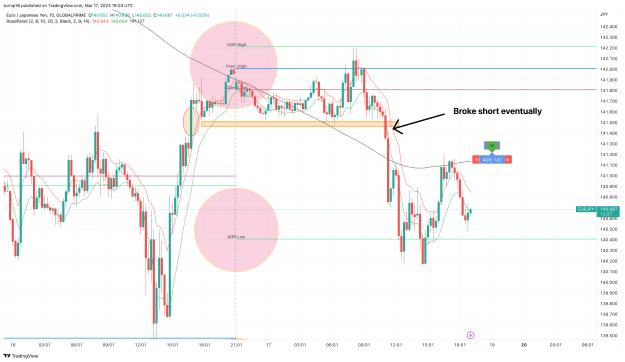
As an experiment have been marking up E/J. Levels marked before 8am UK time. Interested in 15 minute levels and affect of gap( big green bar to the Left -approx 1.41500) Previous High and ADR touched before dropping through level ( pink Horizontal) and hitting lower ADR.
A case of trapping Longs before shorting to lower ADR maybe ?
Just back from taking little grandson swimming. As an experiment have been marking up E/J. Levels marked before 8am UK time. Interested in 15 minute levels and affect of gap( big green bar to the Left -approx 1.41500) Previous High and ADR touched before dropping through level ( pink Horizontal) and hitting lower ADR. A case of trapping Longs before shorting to lower ADR maybe ? Wot you fink peeps? {image}
Just back from taking little grandson swimming. As an experiment have been marking up E/J. Levels marked before 8am UK time. Interested in 15 minute levels and affect of gap( big green bar to the Left -approx 1.41500) Previous High and ADR touched before dropping through level ( pink Horizontal) and hitting lower ADR. A case of trapping Longs before shorting to lower ADR maybe ? Wot you fink peeps? {image}
Ignored
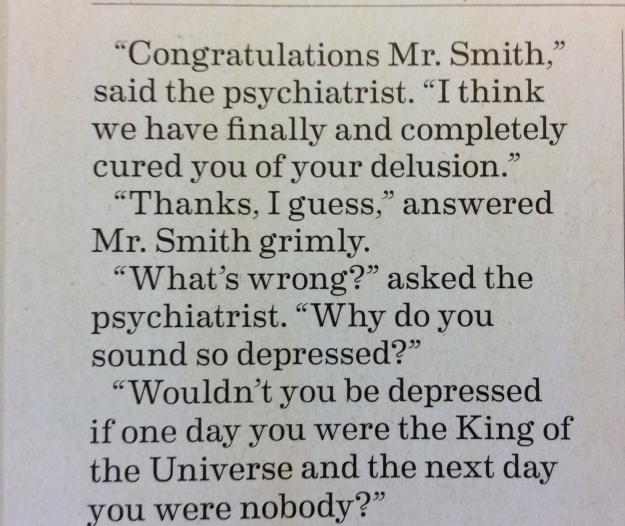
You don't know the ADR High until price has made the ADR Low.
Classic Fake 'n' break at the high.
Same thing happened at the yesterday Low, fake 'n' break of wednesday low.
There were strong divergence signals warning ahead of both fake moves.
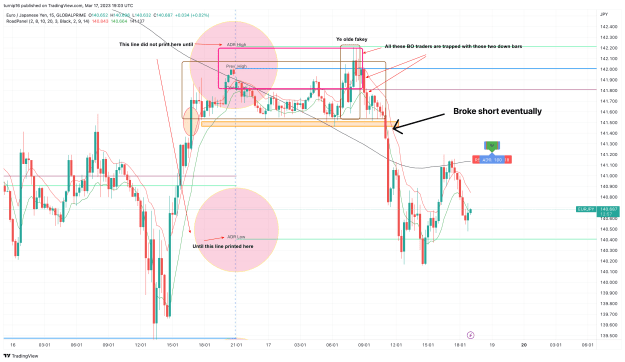
I still have a subscription to The Furrow, John Deere magazine...they post some good laughs at times..here is a current one...remind you of anyone? {image}
Ignored
So to remain Happy, Stay delusional and don't get cured ?
Just back from taking little grandson swimming. As an experiment have been marking up E/J. Levels marked before 8am UK time. Interested in 15 minute levels and affect of gap( big green bar to the Left -approx 1.41500) Previous High and ADR touched before dropping through level ( pink Horizontal) and hitting lower ADR. A case of trapping Longs before shorting to lower ADR maybe ? Wot you fink peeps? {image}
{quote} You don't know the ADR High until price has made the ADR Low. Classic Fake 'n' break at the high. Same thing happened at the yesterday Low, fake 'n' break of wednesday low. There were strong divergence signals warning ahead of both fake moves.
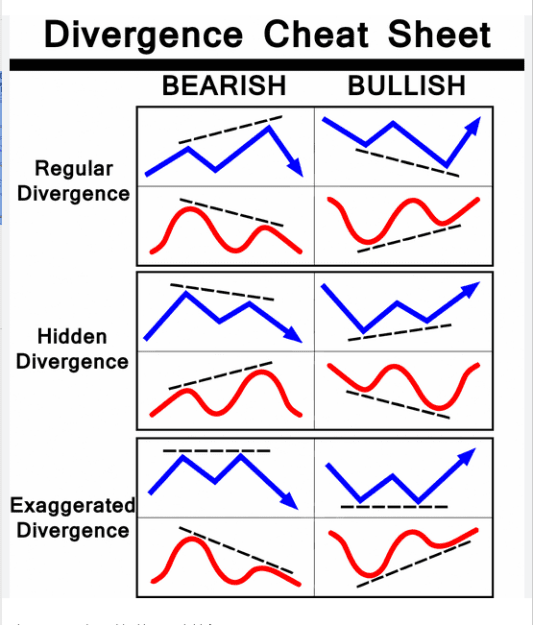
Just to wind up BW et al. Divergence is classic TA with PA.
This doesn't need to be with Oscillators only, it can even be with different correlated currency pairs.
Warnings before the PA happens ..........................
Blue lines are the price chart Highs & Lows, The Red Lines are the oscillators, such as RSI, MACD, Stochs etc. or even another correlated currency pair
{quote} There is No top table that I am aware of, we are all mostly amateur aspring traders with a few pro's visiting now & again to keep us in order and offer advice, it's really up to us, whether we listen to them or the Beatles.
Ignored
When I was young; much younger than today, I had a "Beatles jacket and a pair of "Winkle Picker shoes."
{quote} Just to wind up BW et al. Divergence is classic TA with PA. This doesn't need to be with Oscillators only, it can even be with different correlated currency pairs. Warnings before the PA happens .......................... Blue lines are the price chart Highs & Lows, The Red Lines are the oscillators, such as RSI, MACD, Stochs etc. or another correlated currency pair {image}
Ignored
It's okay - I got him on my ignore list. Saves screen space.