- Search Metals Mine
- 25 Results (1 Thread , 24 Replies )
- kd3726 replied May 15, 2010
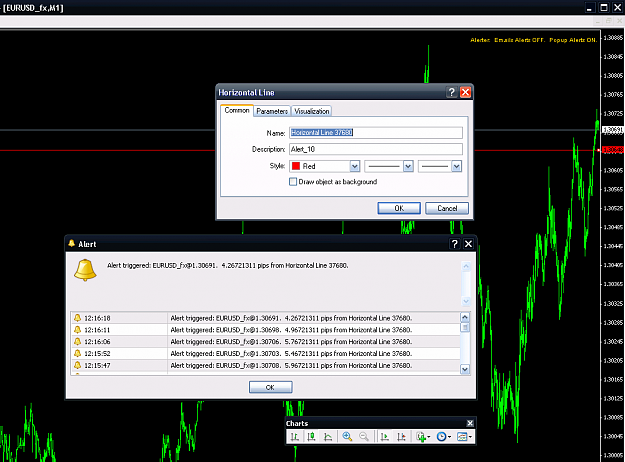
just make sure you have all your stops in for next week, use a double loop incase the first stop fails.
was it an earthquake? no just my EA going bonkers. please help.
- kd3726 replied May 8, 2010
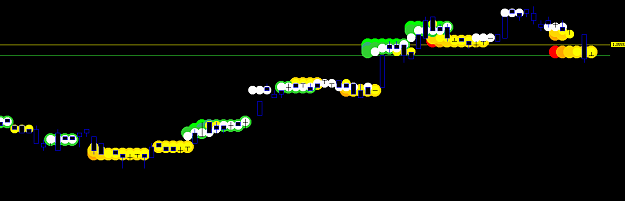
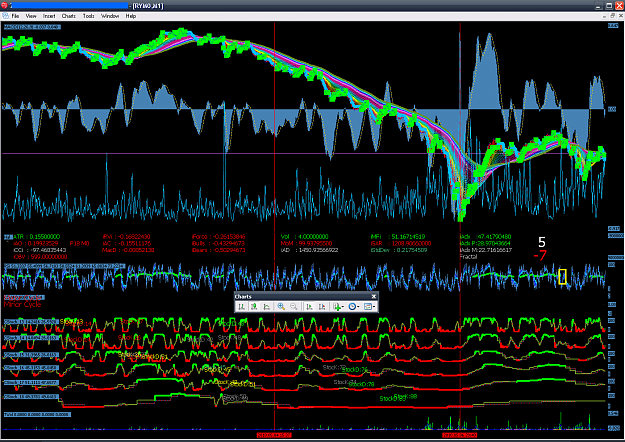
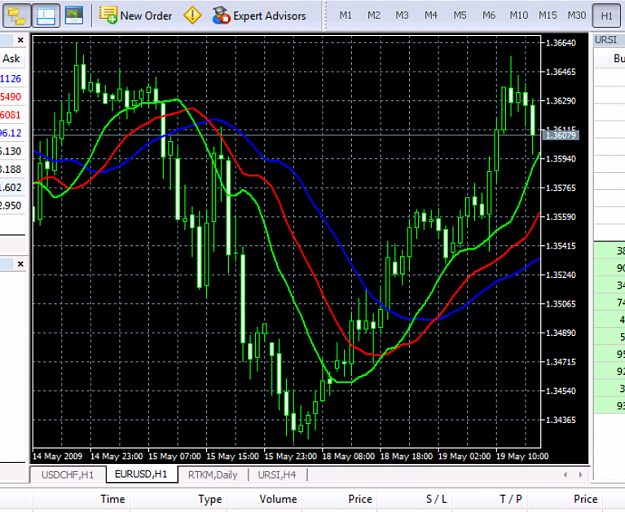
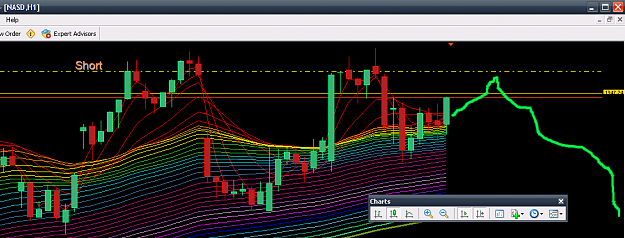
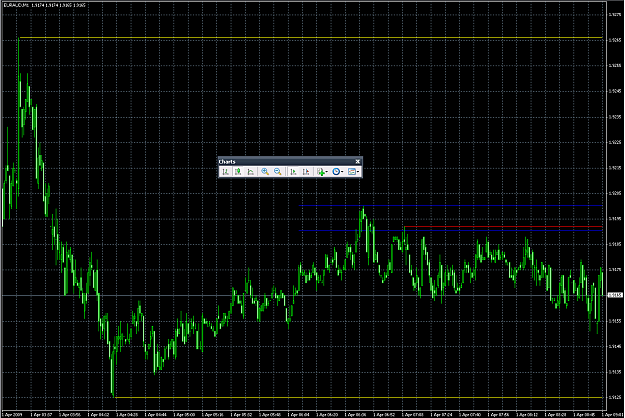
The stochastics clearly showed trouble ahead ( as illustrated below in the wavy red and green Multi Time Frame stochastic lines ) near the bottom of each chart. This was no mistaken key press
1000+ pip market moves...hope everyone got it I have drawn horizonal lines on each of the charts to ...
- kd3726 replied May 5, 2010
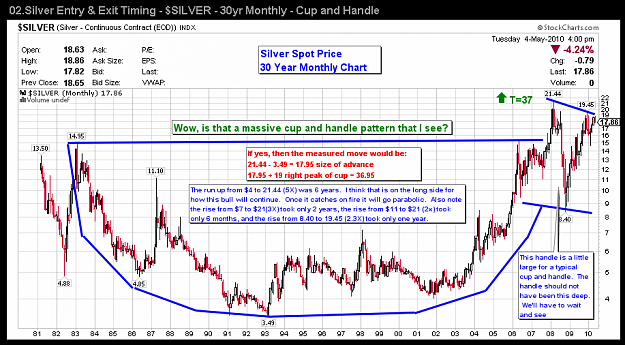
Silver Cup and Saucer? — From Stockcharts - Free Charts Page - Moschell's Charts. Credit where credit is due. Good eye John.
Silver trade calls
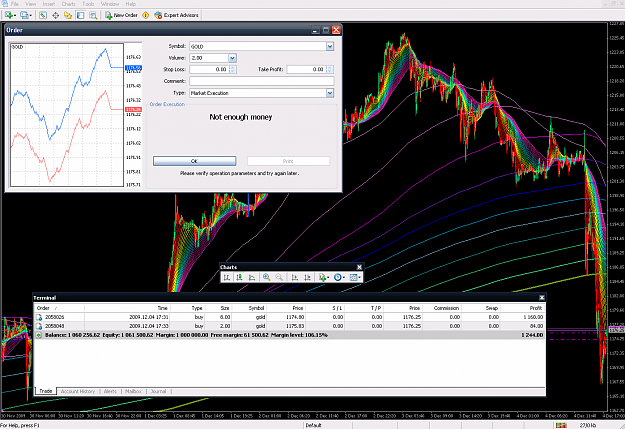
- Margin Limits Error?Started Dec 4, 2009|Broker Discussion|1 reply
Can anyone explain why I am getting this message?
- kd3726 replied Jun 5, 2009
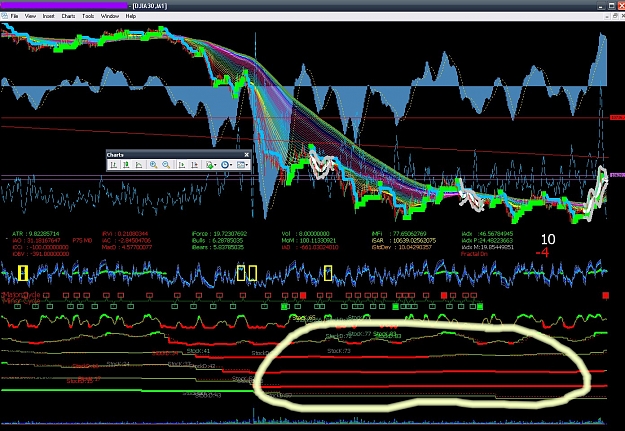
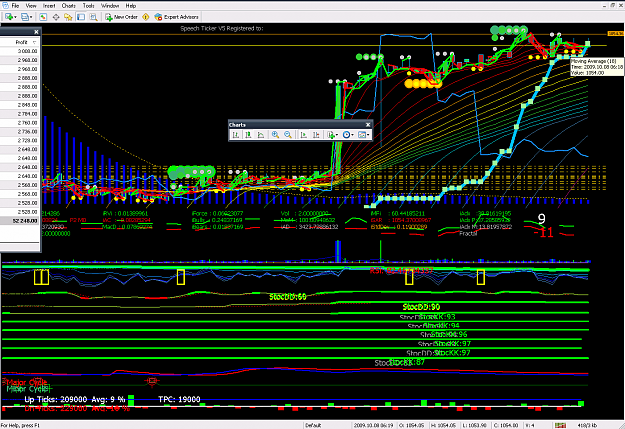
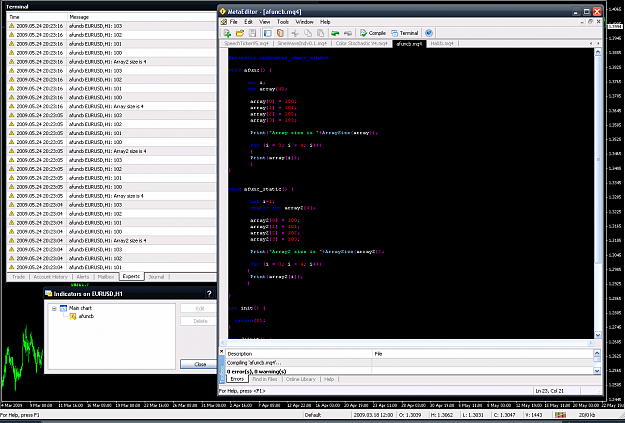
. C'mon guys, even I can do better than that screenshot :O/ url
MetaTrader 5 Client Terminal
- kd3726 replied May 6, 2009
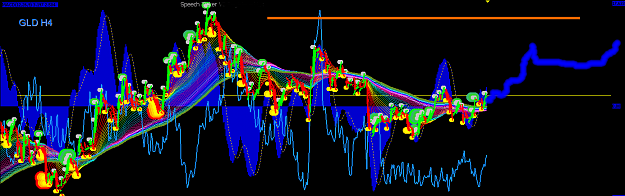
Nice charts everyone! ------------------------------------------------------------- Golds on a run may crack 1000 by the end of the week?
Stocks trending room
- kd3726 replied Apr 26, 2009
Thanks! --------------------------------------------------------------------------- (F) the price is so low the percentage maybe out of whack, and (AN) is taking up all the slack. (BRCM) is there because wireless is hot. (PBG) is probably selling ...
Stocks trending room
- kd3726 replied Apr 24, 2009
Just noticed FDO doubled almost half of it's retail prices recently... home stuff, specifically kitchen stuff is hot. Looks like a 21-30 day downtrend for the dow
Stocks trending room with the Nasdaq possibly seeing less of a drop and diverging somewhat. The online ...
- kd3726 replied Apr 23, 2009
there's two reds and two greens... just dark red and dark green?
Volume Alarm needed for my system.

- kd3726 replied Apr 23, 2009
tried it with a 5 digit broker see pic. not sure what to say.
Help with Indicator
- kd3726 replied Apr 9, 2009
wow the new pad is really comin along
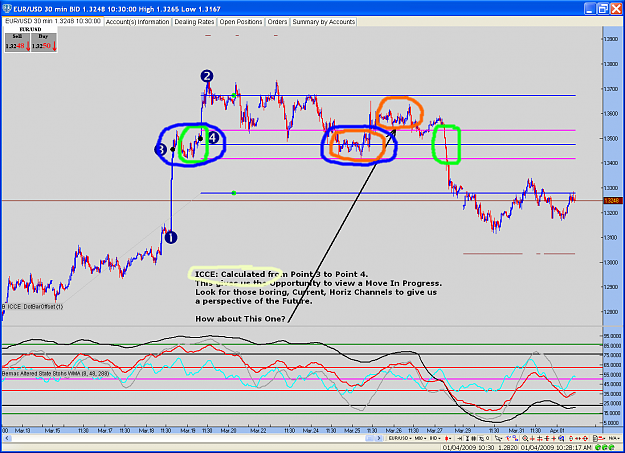
Fib. Reverse Engineered. nice work everyone... Bemac pm me for my source code Ver1e, i fixed the timeframe problem and i left the math calcs as per post #50, errr all wrong  . you can do whatever you like. The reason i'm posting is ...
- kd3726 replied Apr 7, 2009
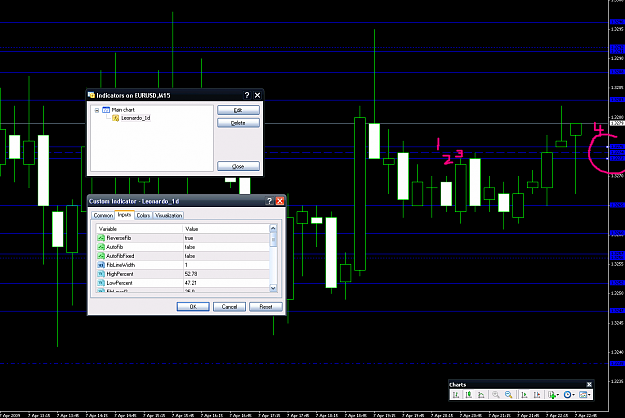
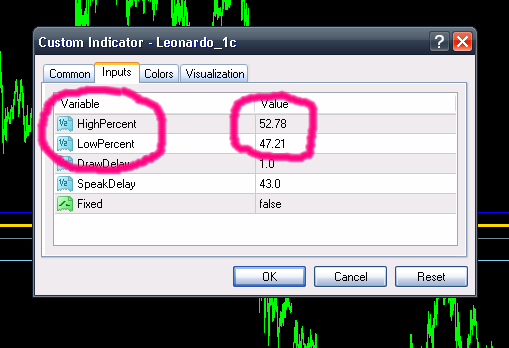
The chart below is EU 15m zoomed (+) all the way in. Adjusting lines 1 and 2 wil set -all- of the other lines. Lines 1 and 2 are the HighPercent and LowPercent. They initially show up at the bid and ask price. Line 3 is the zeroline the halfway ...
Fib. Reverse Engineered.
- kd3726 replied Apr 6, 2009
I put an option to enter whatever percentages you need. sorry i forgot to mention that
Fib. Reverse Engineered. right click -->indicators list--inputs tab or if theres a formula for automatically obtaining the high percent and low percent then i could add that in too. ...
- kd3726 replied Apr 6, 2009
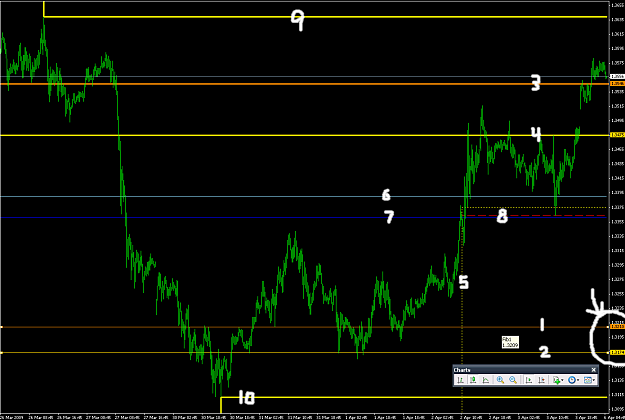
1. Adjustable Top Channel 2. Adjustable Bottom Channel 3. Projected ICCE Top 4. Projected ICCE Bottom 5. Fib 50 % 6. Fib Top Channel 7. Fib Bottom Channel 8. Most Recent Cross 9. Fib Top 10. Fib Bottom The channel lines will first appear at the ...
Fib. Reverse Engineered.
- kd3726 replied Apr 3, 2009
Ok got it, thanks for explaining, i'll add some adjustable levels for your channel to be calculated, long and short, or something similar that will achieve what you've described. hmmmm according to your calculations, your new high is very close to ...
Fib. Reverse Engineered.
- kd3726 replied Apr 2, 2009
Fib. Reverse Engineered. hope everythings sorted out over there! Here's a pile of questions for you to think about once you get everything sorted out over there. Then maybe I can add some of your ideas once i determine how to go about it. I've posted one of your ...
- kd3726 replied Apr 1, 2009
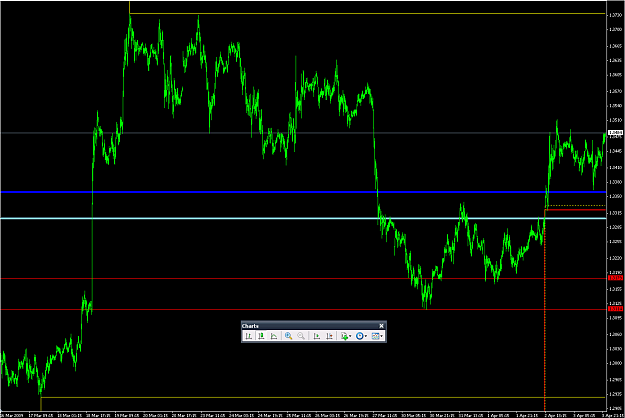
Here's what i've got, the chart is EA 1m yellow lines are top and bottom fibs blue lines are your 46.55 and 54.33 levels red line is the most recent break of your levels
Fib. Reverse Engineered.
- kd3726 replied Mar 26, 2009
that's a good idea, i'll try to work something like that into this hi/low indicator i'm working on, just adding globals for EA's atm. I'd like to add support so the EA can communicate back to the indi.
help programming a price-bar channel