- Search Metals Mine
- 6 Results
- Wheels replied Jul 28, 2013
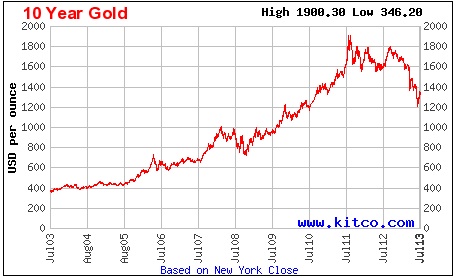
I look at the early 2000s in the context of a post 9/11 world; the new normal etc... Too many variables to make any causal associations regarding gold (goes without saying). But if you look at the 10 year chart, you can see that a lot of the price ...
XAU/USD & XAG/USD - Gold & Silver Traders Thread
- Wheels replied Feb 21, 2013
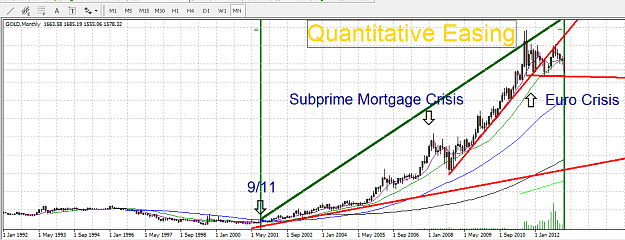
Please don't take this too seriously. Just fun to play with charts. Using Fibo timezone 9/11 to now, and the most consistent multi-year trend lines, I made this chart to have a look at major events and their interaction with price action. Not ...
XAU/USD & XAG/USD - Gold & Silver Traders Thread
- Wheels replied Jan 29, 2013
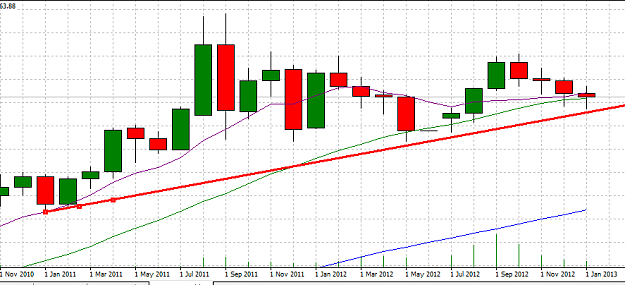
I am looking at the trendline for the previous two years and do not see (or know of) any game changers indicating why gold would drop below. That said, I would not be shocked by two scenarios: 1. Gold gets knocked below to shake out weak longs ...
XAU/USD & XAG/USD - Gold & Silver Traders Thread
- Wheels replied Jan 4, 2012
This is one way that I'm looking at price action. Agree that a close above this resistance level could spell more bullish action. This is a rough chart (didn't plot the Fibs exactly - using 2011 low/high)...also deleted the last one because it was ...
XAU/USD & XAG/USD - Gold & Silver Traders Thread
- Wheels replied Nov 10, 2011
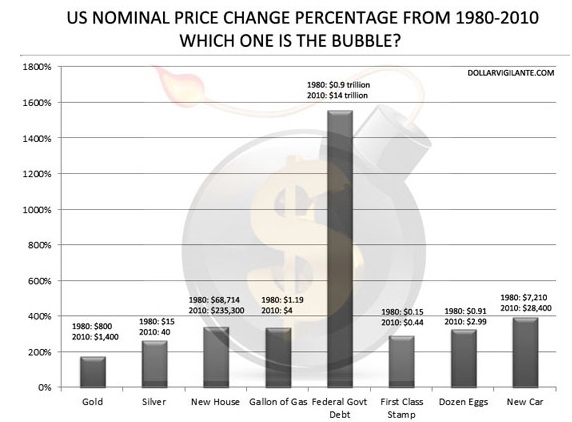
Agreed — If you look at historical data, it becomes clear that gold is not out of step with overall price rises and the massive debt bubble. Silver is not either. I think that's why perma-bears tend to be more-so focused on technical analysis. ...
XAU/USD & XAG/USD - Gold & Silver Traders Thread
- Wheels replied Oct 2, 2011
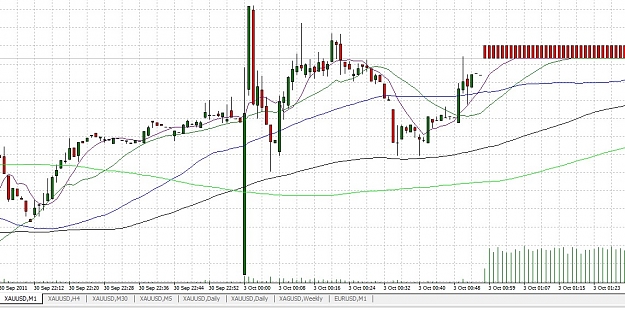
Is this what you are all seeing? — Weird identical stripes on the M1 chart?
XAU/USD & XAG/USD - Gold & Silver Traders Thread
- Posts by Member Search: 'Wheels'