- Search Metals Mine
- 18 Results (1 Thread , 17 Replies )
-
 Abouelzelouf replied Apr 9, 2024
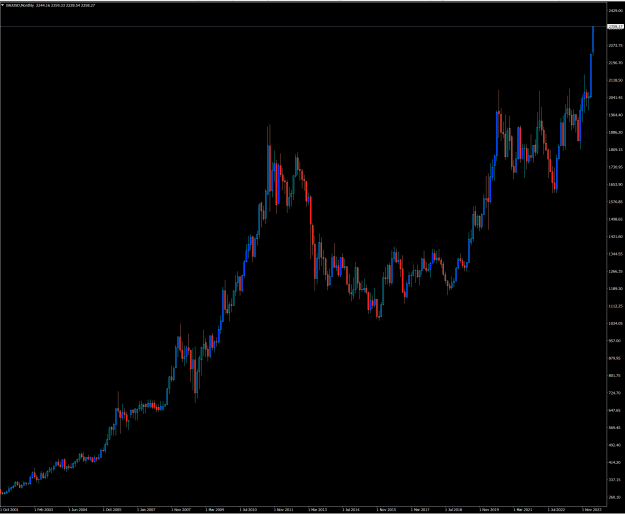
You want to know the target on Gold look at this chart, a monthly chart. Look how gold went up during the years from 2001 to 2010, from 270 to 1900 It is always tempting to look for retracement I have been doing the same like many traders here, ...
Gold
- Abouelzelouf replied Mar 15, 2024
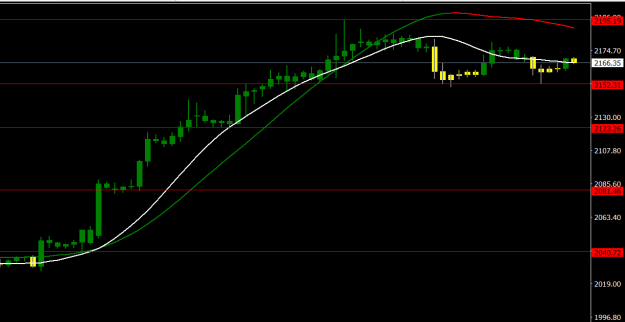
4H chart. My analysis, Gold stuck between 2152 and 2195 for now. On the way up, If it breaks 2185 it will test the highs and try to break higher. on the way down, It tested 2152 2 times it might break it next time to open the way lower. On the top ...
Gold
- Abouelzelouf replied Dec 2, 2022
Hi All, can anyone please help making the US Index indicator work in a mirrored way, is this possible? Original image how I want it to work inverted image
I will code your EAs and Indicators for no charge

- Abouelzelouf replied Oct 19, 2011
we are back at the major resistance, around 1.5850. let us see if it will break it this time.
Cable Update (GBPUSD)
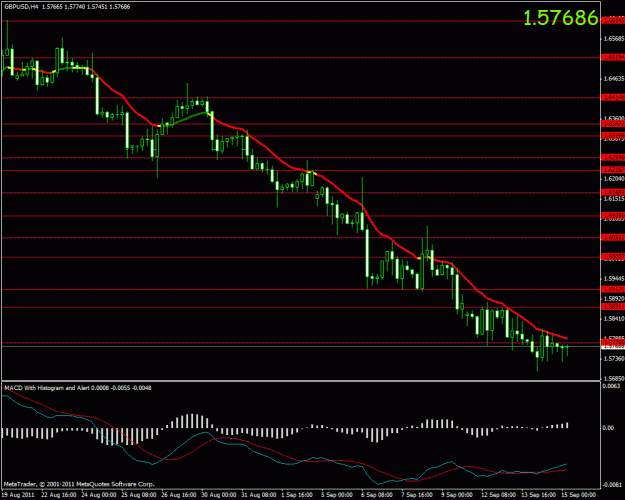
- Abouelzelouf replied Sep 15, 2011
the trend down is getting less volume and indicators pointing up. if and only if we good good results from retail sales.
Cable Update (GBPUSD)
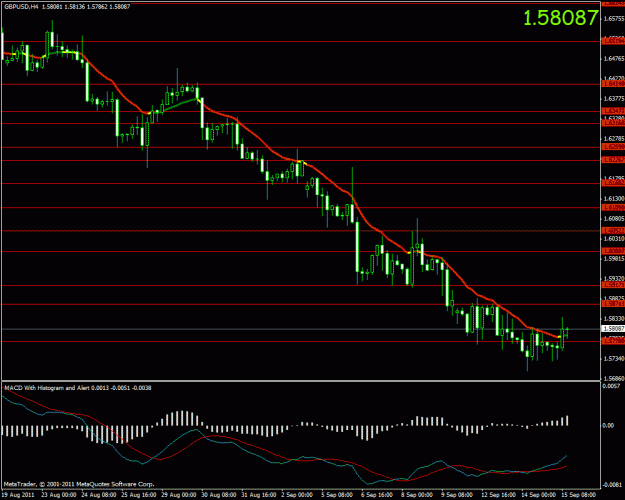
- Abouelzelouf replied Sep 14, 2011
gbp/usd 4H chart — simple chart that tell it all!
Cable Update (GBPUSD)
- Abouelzelouf replied Aug 3, 2011
this is how you should post a chart. and we will all like it.
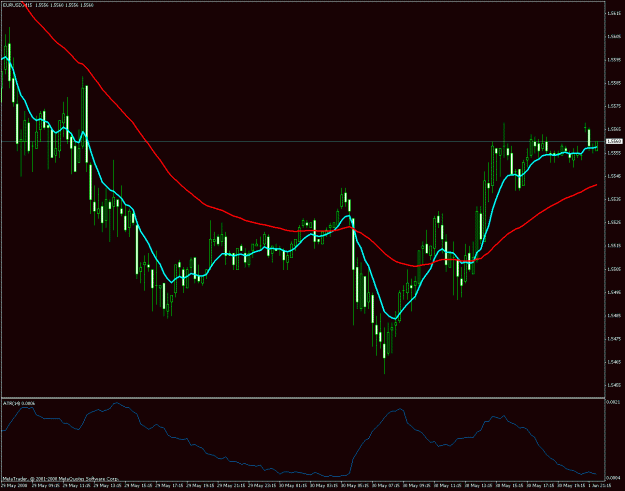
USD/CHF
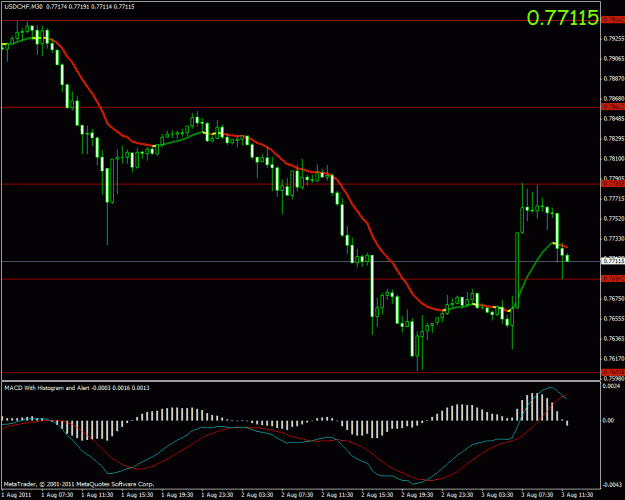
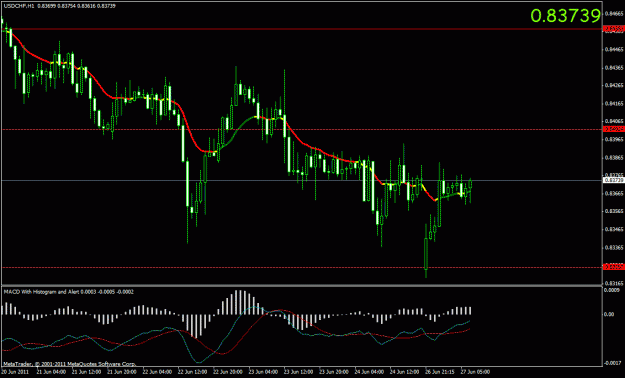
- Abouelzelouf replied Jun 27, 2011
Let us see how this will play now, I think all will depend to the news from US positive or negative.
USD/CHF
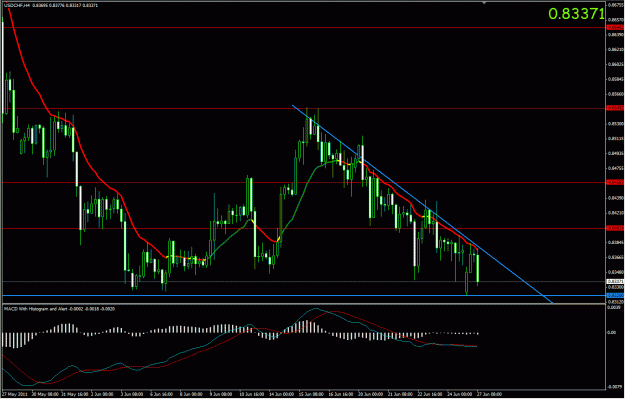
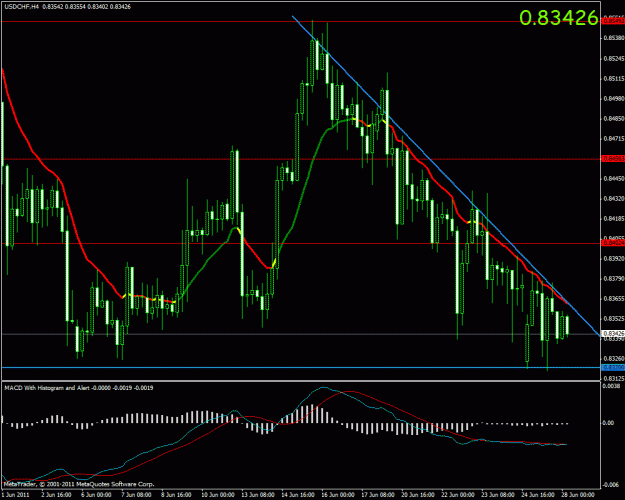
- Abouelzelouf replied Jun 27, 2011
we need to see a break above 0.84 and hold. other wise we will still see more lows.
USD/CHF
- Abouelzelouf replied Mar 9, 2011
If 0.9330-20 today holds then will see more highs specially if oil prices remain at this level or drop down.
USD/CHF
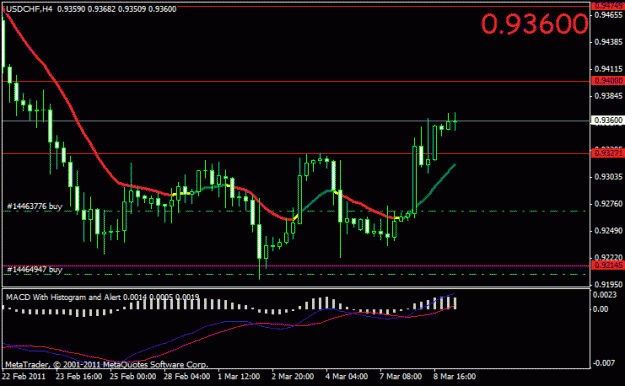
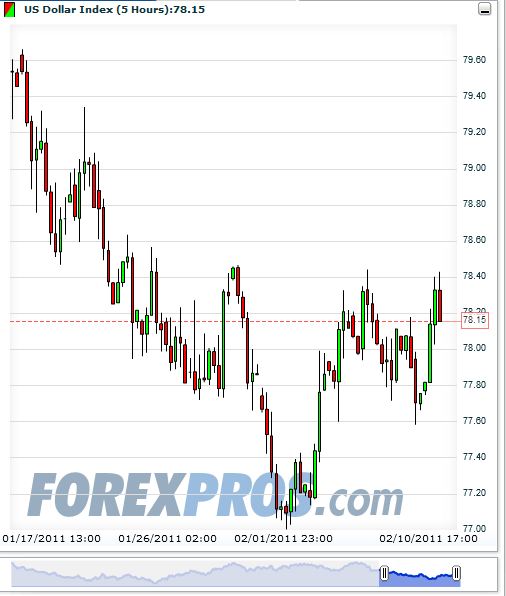
- Abouelzelouf replied Feb 10, 2011
US index is facing a big resistance at 78.40 it is good there is weakness in CHF and jpy other wise they would have went downnnn.
USD/CHF
- Abouelzelouf replied Jun 1, 2008
as it has been said before no one can say it is good or bad system. it depends to your style of trading, some will see it nearly to cross and enter early, others oh! I want to see it cross then enter, others will wait for the new candle to open ...
Could this system work
- Abouelzelouf replied May 20, 2008
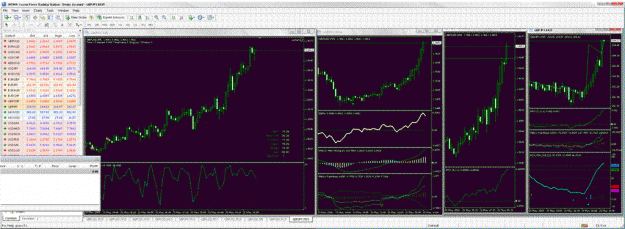
I am using 2 screens and my charts work like that. the first chart on the left is on one screen and the and 3 other charts on the 2nd screen.
multiple screen layout
- Abouelzelouf replied Dec 4, 2007
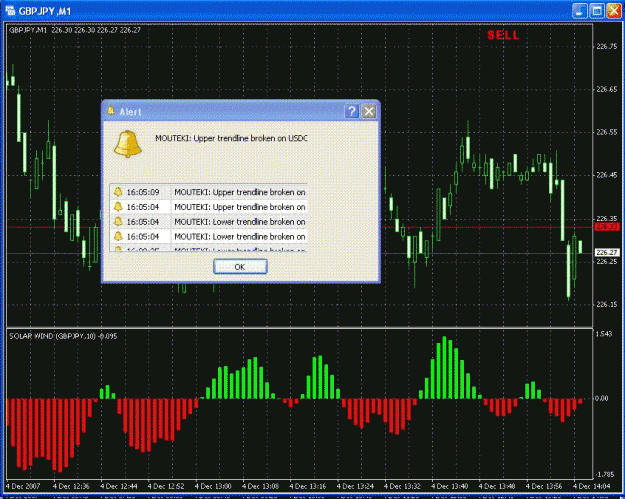
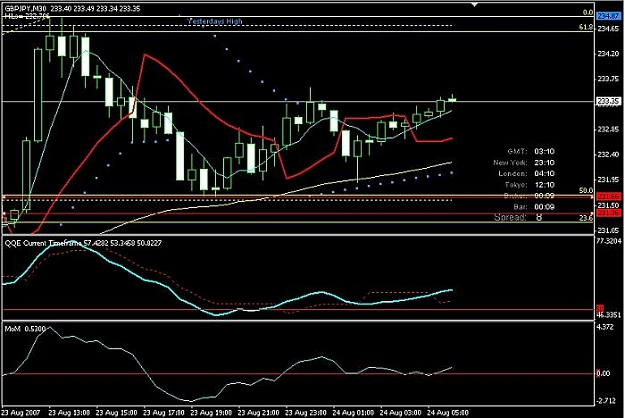
sorry Chandra the alert is not showing a message it is just writing sell or buy on chart. if you can please make it like the mouteki alert in the chart with a message like solar wind on GBP/JPY crossed below 0 or over 0. thank you.
can anyone help me to add alert to this indicator
- Did anyone notice this on FXCM NZD/USDStarted Feb 26, 2007|Broker Discussion|1 reply

Did anyone notice this on FXCM NZD/USD litle less then 400 pip spike!!! on the 18 of February.

- Posts by Member Search: 'Abouelzelouf'