- Search Metals Mine
- 25 Results
-
 jimobiwan replied Nov 2, 2012
Having problems posting the chart
XAU/USD & XAG/USD - Gold & Silver Traders Thread
- jimobiwan replied Oct 13, 2012
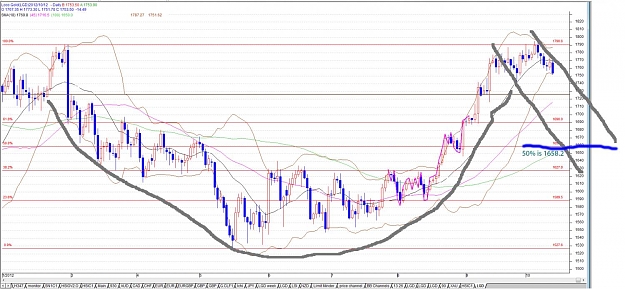
Hi Xtrade. is the cup using 29FEB high to 16MAY low? I read that a handle is normally no more than half the cup which puts it at 1658.2 and takes 4 weeks to form. Is that what you are seeing?
XAU/USD & XAG/USD - Gold & Silver Traders Thread

- jimobiwan replied Aug 26, 2012
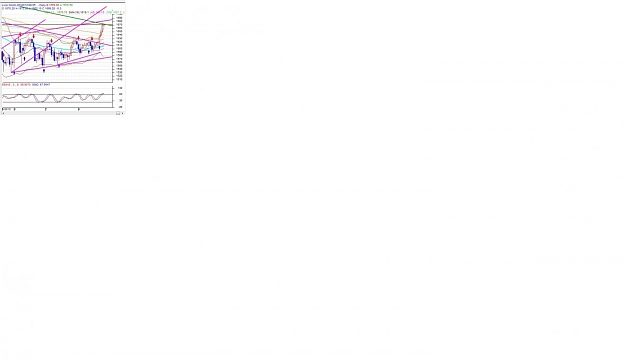
I'm bullish but short into the weekend (looking at first chart, short 1671, then 1674, as PA hit the two sloping downtrend lines). I am looking for only 1665 (half distance to a retest of the downward sloping trend line at about 1659) after which i ...
XAU/USD & XAG/USD - Gold & Silver Traders Thread
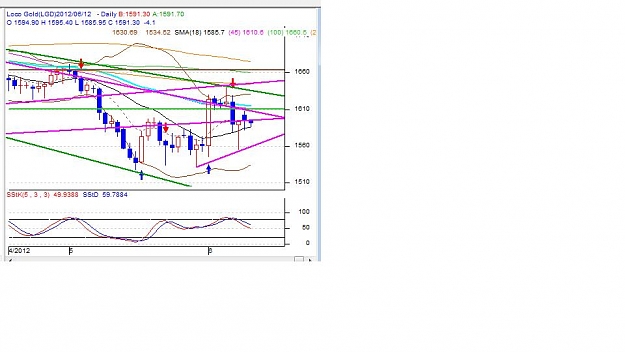
- jimobiwan replied Jun 12, 2012
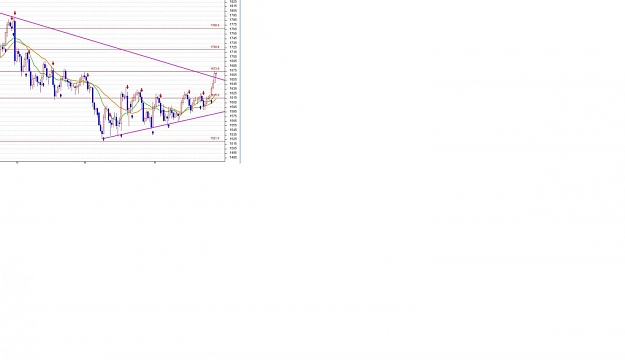
XAU is in a wedge and still above the 18DMA (Black line) which has been tested for 4 days with one deep exploration on FRI with large day range rebound. STOs working off over bought condition.
XAU/USD & XAG/USD - Gold & Silver Traders Thread
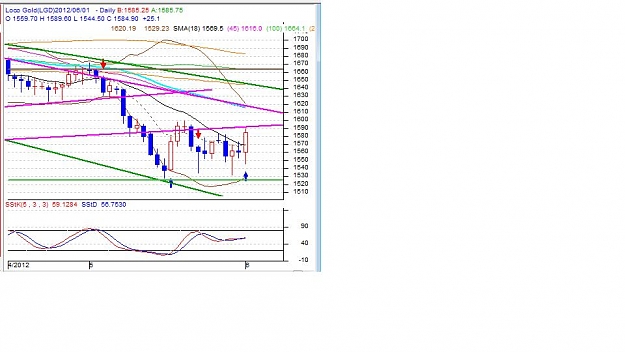
- jimobiwan replied Jun 1, 2012
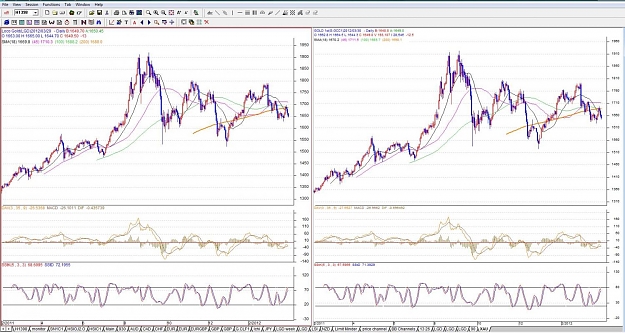
Here is a chart of daily XAU. the Black line is the 18dma. see how it works - see when the market is below, it runs up to it and fails on several days. when the market closes above the 18dma, i look for the long side. So the 18dma forms a pivot to ...
XAU/USD & XAG/USD - Gold & Silver Traders Thread
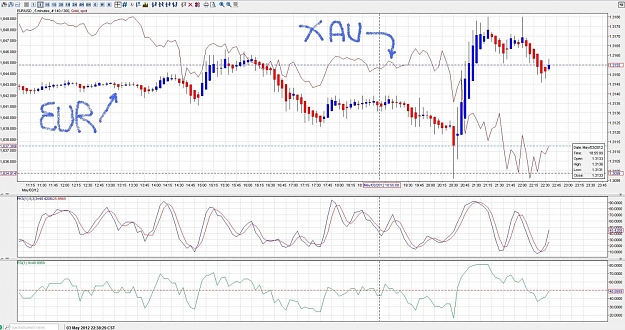
- jimobiwan replied May 3, 2012
A 5 min EUUSD w XAU/USD for comparizon
XAU/USD & XAG/USD - Gold & Silver Traders Thread
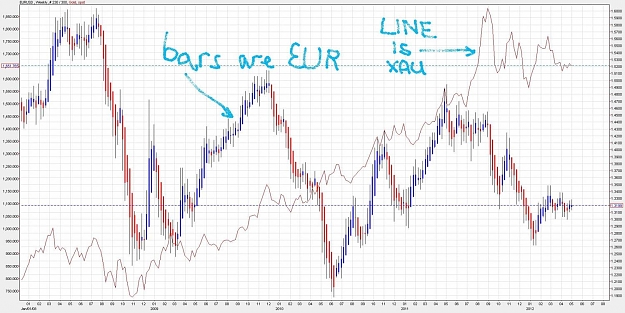
- jimobiwan replied May 2, 2012
Be Vigilant my friend. They dance together until they don't. See the chart which is weekly.
XAU/USD & XAG/USD - Gold & Silver Traders Thread
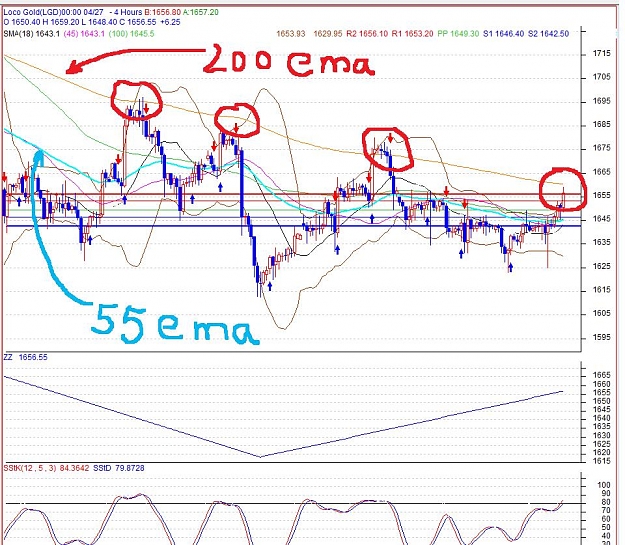
- jimobiwan replied Apr 26, 2012
i am with you on that. looking to get out of longs at or near 200ema on 4 hr. attached chart shows the 200ema on 4hr
XAU/USD & XAG/USD - Gold & Silver Traders Thread
- jimobiwan replied Apr 14, 2012
oops, forgot to attach the chart
XAU/USD & XAG/USD - Gold & Silver Traders Thread
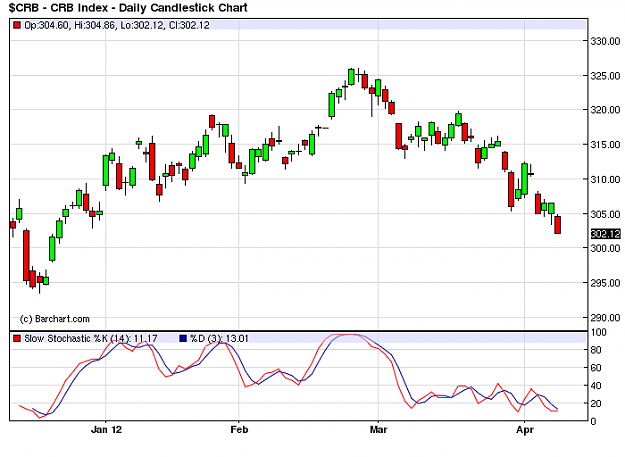
- jimobiwan replied Apr 10, 2012
Outside day down and still under the 18DMA (@1654). Does anyone pay attention to the CRB index when trading XAU? CRB trending down Some telling numbers on thurs and fri. Perhaps holding in range until more direction at the end of this week.
XAU/USD & XAG/USD - Gold & Silver Traders Thread
- jimobiwan replied Mar 29, 2012
notihing shows up on xau
XAU/USD & XAG/USD - Gold & Silver Traders Thread
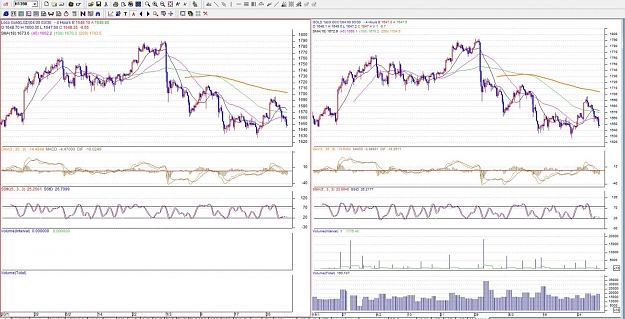
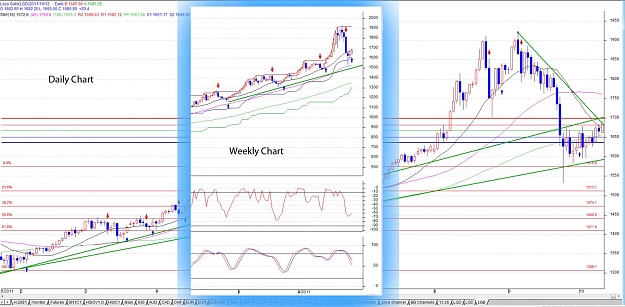
- jimobiwan replied Mar 29, 2012
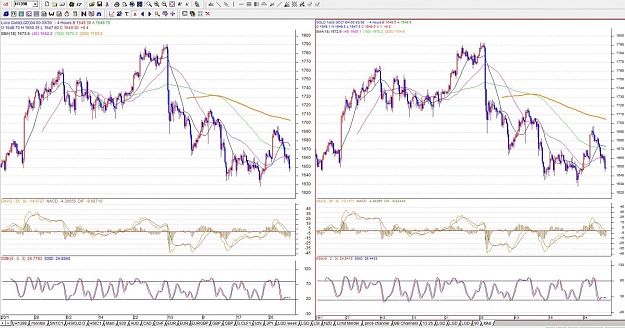
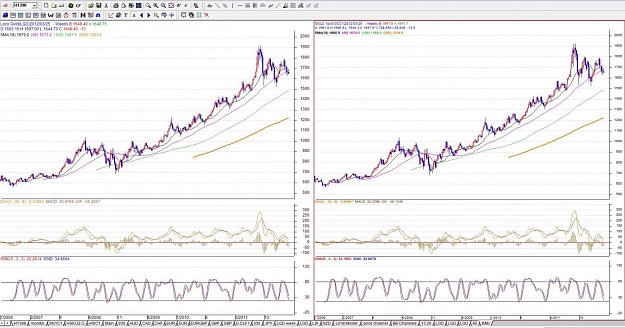
as promised, here is a side by side comparison for weekly gold. XAU is on the left, Front Month GOld FUtures is on the right. Second chart is daily. DMAs are 18, 45, 100, 200 Slow Sto and MACD shown Does anyone see any advantage of monitoring G.GCC1 ...
XAU/USD & XAG/USD - Gold & Silver Traders Thread
- jimobiwan replied Dec 21, 2011
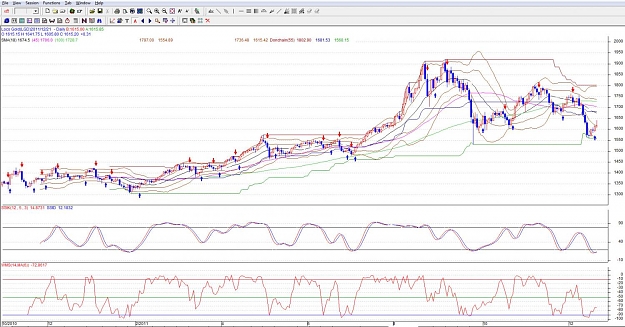
PA just on the edge of the neutral zone in my envelop study. Today went through then back down at the 200DMA. Normal PA on reaching first MA. PA now bouncing between 23.6 and 38.2% feb. I am looking for an inside day tomorrow to reasses entry.
XAU/USD & XAG/USD - Gold & Silver Traders Thread
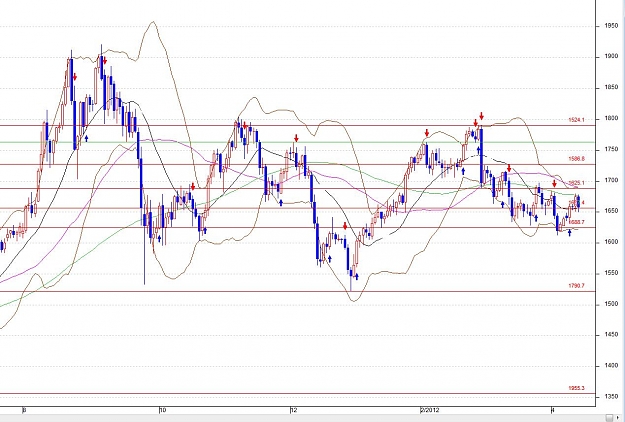
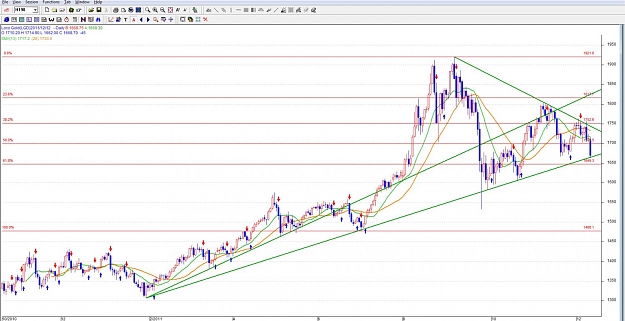
- jimobiwan replied Dec 12, 2011
Au has fallen to the uptrend line and support in chart. Early DEC normally sees some weakness. PA under 18, 45 and 100 DMA and nearly at lower BB. Long again at 1665.3.
XAU/USD & XAG/USD - Gold & Silver Traders Thread
- jimobiwan replied Oct 12, 2011
I see the PA has coincidentally moved back over the 18dma in both the weekly and daily. 50% Fib is at 1727.2, 55EMA on daily is at 1701.7. DRange is already $32. I'm thinking more consolidation in range maybe even retesting lower as the SSTK is ...
XAU/USD & XAG/USD - Gold & Silver Traders Thread
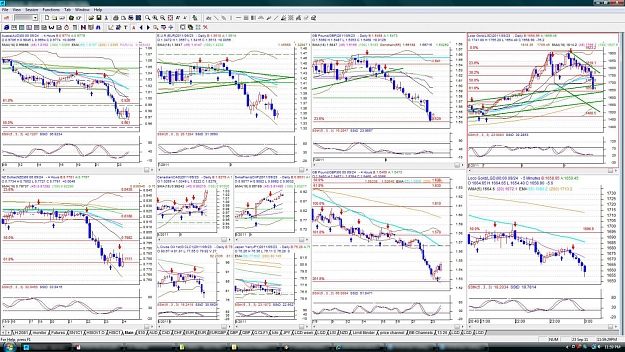
- jimobiwan replied Sep 23, 2011
See chart - Top R box is XAU
XAU/USD & XAG/USD - Gold & Silver Traders Thread
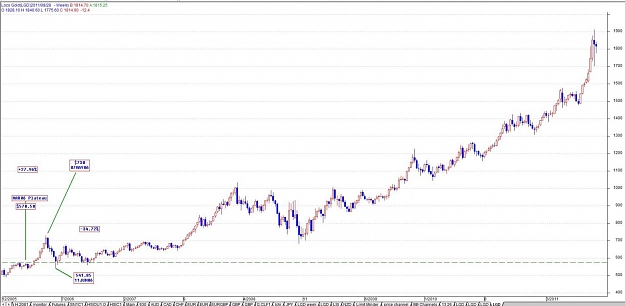
- jimobiwan replied Aug 31, 2011
--- Chart attached - This is a weekly chart though. couldnt use a daily to see both 2006 and 2011
XAU/USD & XAG/USD - Gold & Silver Traders Thread
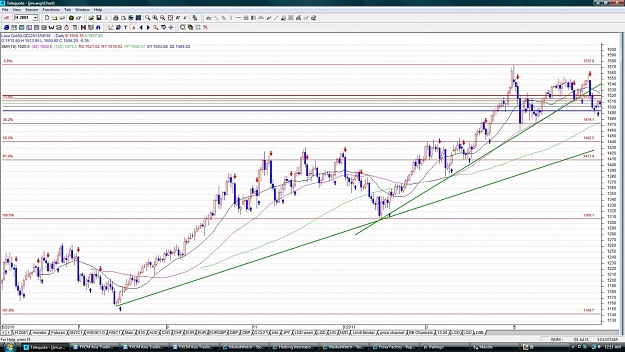
- jimobiwan replied Jun 30, 2011
I see 18DMA arcing down. Chart is daily. 50% retracement is seen often in gold and that would bring us to 1442.5. 100DMA is 1474.5. Gold is normally weak in this seasonal. I read an article on Fib Time cycles and calls for a low at about 19AUG11. ...
XAU/USD & XAG/USD - Gold & Silver Traders Thread
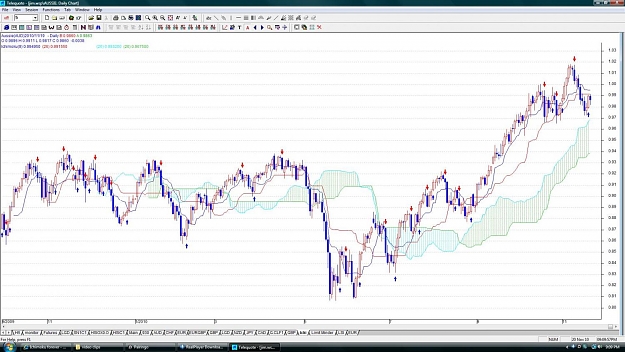
- jimobiwan replied Nov 20, 2010
I see Ichi charts with clouds extended to the right of the price action. This is what i get on my system, the price action and cloud are in-line with each other. Is this a normal Ichi chart or is the setting wrong? I am using the default setting.
Ichimoku forever