Resistance Level Support
1 1620.00 1680.00
2 1600.00 1700.00
INDICATOR VALUE
Stoch (14) ↓ 51.18
RSI (14) ↓ 41.60
MACD (9) ↓ -3.83
PAR SAR (9) 1614.84 ↓
EMA (20) 1652.77 ↓
EMA (50) 1664.55 ↓
For day-to-3 experienced a correction in gold prices and for the second
time test of major support at the trendline 1. This condition is necessary
The main concern of this support to be given a reference or
Early indicators to identify the emergence of a bearish signal
strong possibility in this category. If the session today gold
recorded a new low (break-low) then the target closest
1620-an estimated level.
Outlook on exposure ago that gold has 2
possibilities, 1) correction and restrained on a new trendline will
recoup (closed back) to 1670's level. 2) the gold penetrate
1 and the new trendline will recoup to the 1650 level.
INDICATOR VALUE
Stoch (14) ↓ 14.85 RSI (14) ↑ 31.80 key
MACD (9) -13.01 ↓
PAR SAR (9) 1666.43 ↓
EMA (20) 1636.45 ↓
EMA (50) 1655.19 ↓
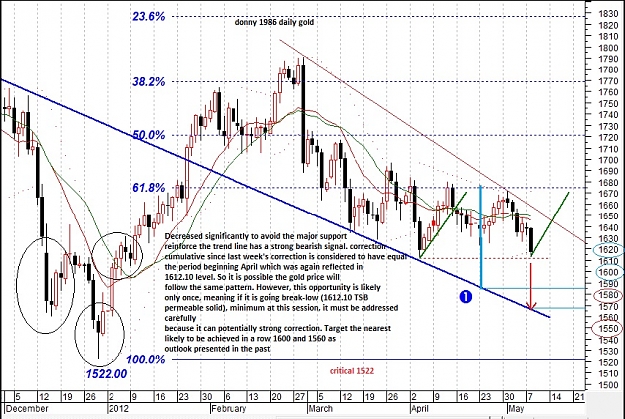
The emergence of a sharp correction towards the end of this week is not
can be avoided. This gesture is suggested that since the price has actually
gold is still hovering on the trendline 1, during the period
April. It means that as long as not stay away from the main support
then have to watch out for potentially emerging a strong correction.
Defined as a bearish signal from the end of last week gold
through it again and was followed by closure
in negative territory. Thus, it is possible
gold will complete the pattern of down-channel line (the gap between
trendline 2 and 3), meaning that the correction leads to opportunities in 1560's and
with the target followed by a rebound in 1610, and 1630's.
Resistance Level Support
1 1540.00 1612.00
2 1520.00 1620.00
INDICATOR VALUE
Stoch (14) ↓ 11:37
RSI (14) ↓ 27.84
MACD (9) -15.41 ↓
PAR SAR (9) 1663.27 ↓
EMA (20) 1634.11 ↓
EMA (50) 1637.12 ↓
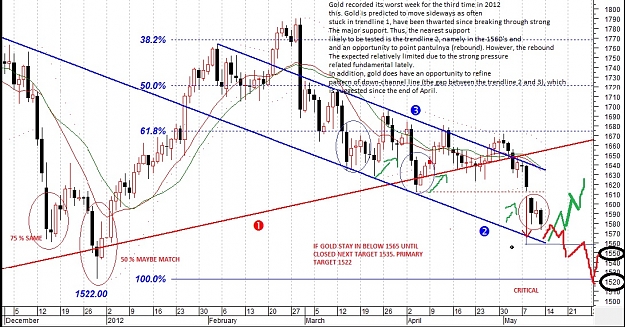
Gold recorded its worst week for the third time in 2012
this. Gold is predicted to move sideways as often
stuck in trendline 1, have been thwarted since breaking through strong
The major support. Thus, the nearest support
likely to be tested is the trendline 2, namely in the 1560's and
and an opportunity to point pantulnya (rebound). However, the rebound
The expected relatively limited due to the strong pressure
related fundamental lately.
In addition, gold does have an opportunity to refine
pattern of down-channel line (the gap between the trendline 2 and 3), which
is suggested since the end of April.
S 2 S 1 Pivot Point R1 R2
1559.76 1569.23 1582.16 1591.63 1604.56
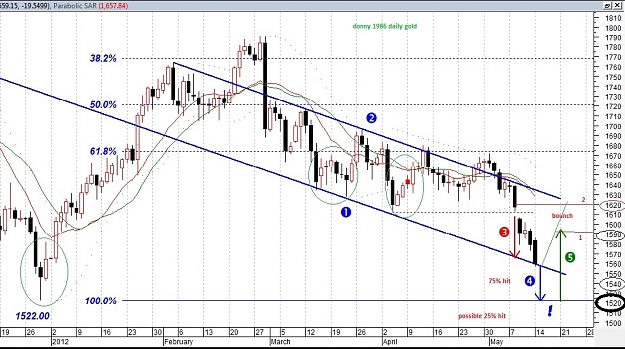
Gold off to a sharp weakening after the record
the worst weekly drop-3 during the year of 2012. meanwhile
targets to support trendline 1 of the pattern of down-channel line also
met, meaning that a strong bearish signal, especially for
short-term, potentially to be continued in this period. though
will be captured, the possibility can not last long and the pressure
will again dominant. Thus, the target of the next support
are likely to be tested is the bottom level of the end of December,
then the 1522. This level can also be assumed as the critical level
because if penetrated strong, did not rule out gold
phase down-trend. 1522 level as a point jg interchangeable rebound.
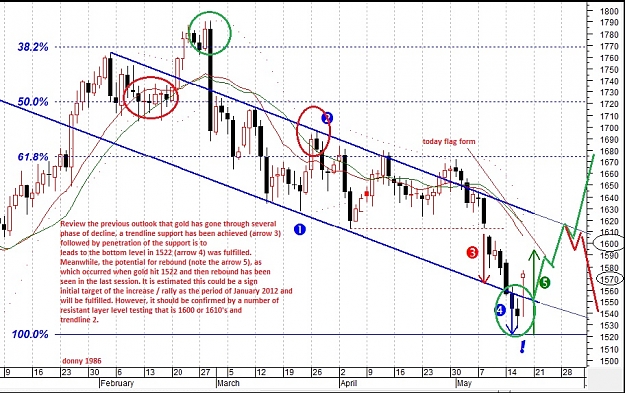
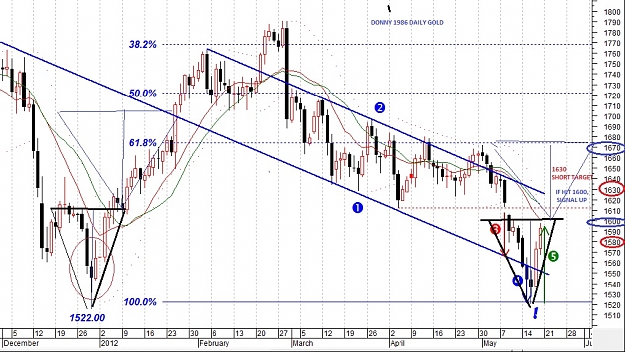
Review the previous outlook that gold has gone through several
phase of decline, a trendline support has been achieved (arrow 3)
followed by penetration of the support is to
leads to the bottom level in 1522 (arrow 4) was fulfilled.
Meanwhile, the potential for rebound (note the arrow 5), as
which occurred when gold hit 1522 and then rebound has been
seen in the last session. It is estimated this could be a sign
initial target of the increase / rally as the period of January 2012 and
will be fulfilled. However, it should be confirmed by a number of
resistant layer level testing that is 1600 or 1610's and
trendline 2.
Stoch (14) ↑ 28.21 RSI (14) ↑ 43.71
MACD (9) -23.19 ↑
PAR SAR (9) 1613.52 ↓
EMA (20) 1600.86 ↓
EMA (50) 1615.92 ↓
It is estimated there has been no fundamental change in outlook on
this week. A number of targets, either up or down when the phase, has been
met. Note the arrows 3 and 4, a significant correction of post
early 1615's the second week of May, has been
met. Furthermore, the target rebound, which is based on the pattern
reflecting the end of December 2011 and early January 2012 and, as a prefix
also realized.
Gold still has a targets resistance in the 1600s and only after that
there are two possibilities: 1> going through a phase of calm
(consolidated) in the area from 1600 to 1680 rally's or straight match
pattern is exactly the same early January (min. above 120 points).
Gold rose more than 1 percent
on Friday, two days recorded the biggest gain since October,
driven by the consolidation of positions ahead of the investor-owned
weekends and the strengthening euro.
Gain a second day to help increase self-confidence,
which has been shaken by the fall of gold early this week to the lowest
within four months at $ 1,527 per ounce, close to the critical support level
long-term.
But traders remained cautious given how the crisis
increases in Europe have been pushing the single currency weakened
this month.
"There is still no confidence in the market. If gold is the place
safe (safe haven), should be strengthened. physical demand
is mediocre and the Europeans want a dollar, that's
why gold is very strong,
S 2 S 1 Pivot Point R1 R2
1555.46 1574.18 1585.86 1604.58 1616.26
tips
buy new 1585-1587 target 1-10 point
sell new 1603-1604 target 1- 3 point
all tips must see candels AND NEWS update WARNING !!!
RANGE 1580.00 - 1610.00
Resistance Level Support
1 1560.00 1620.00
2 1540.00 1640.00
INDICATOR VALUE
Stoch (14) ↑ 42.14
RSI (14) ↑ 44.30
MACD (9) -21.03 ↑
PAR SAR (9) 1603.09 ↓
EMA (20) 1603.31 ↑
EMA (50) 1634.19 ↑
Venturing into this week's gain appears relatively limited, but
1610-an opportunity to keep an open mind the momentum after the
strong rally last weekend was predicted. while
it, is a technical rebound category which generally lasts
moment. The possibility of gold in the quiet phase after correction
cumulative since the beginning of May. However, during the gold
hovering in the area of trendline 3, the tendency to fall
some more can be realized.
Resistant targets are met in the 1600's, gold is also likely to
straight rally in early January that match the pattern exactly (min.
above 120 points).
1540.00 - 1570.00
Resistance Level Support
1 1520.00 1580.00
2 1500.00 1600.00
INDICATOR VALUE
Stoch (14) ↑ 31.54
RSI (14) ↑ 41.14
MACD (9) -20.80 ↑
PAR SAR (9) 1586.38 ↓
EMA (20) 1573.74 ↓
EMA (50) 1596.29 ↓
Gold likely to consolidate following a series of still
decline since early May, which reached 144 points ($ / ozt)
more. Generally, these conditions would create a price
through a phase known as the take-a-breather for
some time (a week minimum).
On the other hand, gold is likely to move according to the pattern of down-channel line
trendline formed from 1 and 2. Possibilities that arise
technical rebound after gold had 2 weeks ago.
Nevertheless, these conditions remains to be seen considering the
gold price still hovering in the area categorized as adequate
which is critical in the 1520's level.
Pivot Point S1 S2 R1 R2
1542.76 1557.53 1565.86 1580.63 1588.96
Can anyone tell me or msg me in private please what is the standard deviation of gold in the last five years? Also how can I check that with all the other metals or currencies thank you.
Session began yesterday, gold tends to stagnate and not followed
with high break-earlier period, indicating sentiment
which was varied (mixed). In addition, the power gain and
loss is also relatively balanced (neutral) so it does not cover
Sideways will likely continue. Even so,
with the current position still needs to be monitored because of the gold still exists
slightly above the critical support that the scale of 61.8% Fibonacci Fan (now
in 1540-an area) are prone to penetration.
Opportunities to increase expected only in 1600, the minimum session
or the next day. But if it does not happen, gold will likely
experience at least mild pressure to the 1550's anymore.
s2 s 1Pivot Point R1 R2
1528.00 1542.40 1562.55 1576.95 1597.10
next S2 target will see but will rebound again to open
INDICATOR VALUE
Stoch (14) ↓ 57.36
RSI (14) ↑ 50.45
MACD (9) -2.50 ↑
PAR SAR (9) 1639.16 ↑
EMA (20) 1594.34 ↑
EMA (50) 1613.37 ↑
Volatility in gold prices last week was quite high,
characterized by the highest and lowest achievement levels in
short amount of time. A number of targets have been achieved
adjust the conditions previously thought, including
1640 reaching a level that leads to a nearest-resistant targets in
1650 with the condition are able to penetrate the first 1630's.
So it is with the price reduction.
From the last condition allows the gold price remains
consolidate the range of relatively the same alias rangebound,
meaning of positive and negative forces are expected to balance.
Due to high volatility and high spread all r requested to take 1% risk till 20th june.Donny we want you to back again with more experience and sharp assumptions.
1600.00 - 1630.00
Resistance Level Support
1 1600.00 1640.00
2 1580.00 1660.00
INDICATOR VALUE
Stoch (14) ↓ 83.72
RSI (14) ↓ 54.74
MACD (9) ↑ 5:35
PAR SAR (9) 1557.16 ↑
EMA (20) 1606.56 ↑
EMA (50) 1615.02 ↑
Upper trendline resistance (dashed line) was tested, this
indicates intraday correction in the previous period
almost reached the level of the 1600's are not that bearish mensugestikan
quite strong, especially the price closed on positive territory. then
as the previous outlook that if the resistance is
breached, then there is the possibility of bullish opportunities for
short-term.
However, if the penetration is not capable of
maintained, ie no longer able to survive in the 1630 minimum
in session today, then gold is expected to move in a pattern
down-channel line up this weekend.