I think gold will little down in recent days,if gold break the 1600 point then it will be go down more like 1550-1530,though i guess within 2 days gold will reach 1660-1680,then little go down,but gold will up again after 20th April and there is a strong chance gold will hit 2000 up coming days.
last but most important fact is there is many Speaks,Survey reports from major currency like - fed,bomc etc..
we need to watch carefully how market reflect after this type of reports.
not . i m see still impact fundamental so down
area still in target
Ignored
Hi Donny, I think you didn't get my point, I wanted to tell that gold tried but didn't break 1648 which is my resistance according to murry's math and you worte that the resistance is 1645, so I asked you which one is correct. if 1645 is resistance then gold broke it sharply but couldn't hold that position, so consolidation is possible and which gold did by fall to 1636. Now I am waiting for barnanke to open next position. I hope you got my point
i just want to ask, after bernanke speak, gold still break 1650. is it signal that gold will up again? cause i see that gold still so hard to get down.
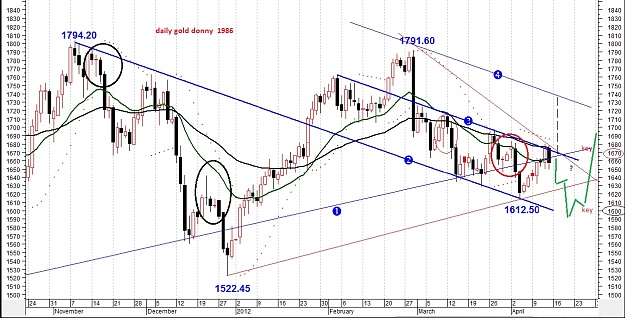
Increase is quite impressive amid increasing market momentum. Need to watch out because the price has reached a level of upper end of the downtrend channel (trendline 3 area 1600-1660) that if up to the target trend 4 . reversal signal will be formed to open up opportunities to the upside trendline 4 1670- 1720.But if the price is not strong to do the penetration, the price is expected to resume its downtrend again in trend line 3.See my pic. S2 S1 Pivot Point R1 R2 1638,70 1657,10 1668,60 1687,00 1698,50
. INDICATOR VALUE STOCH (14) ↑ 60.87 RSI (14) ↑ 52.54 MACD (9) ↑ -9.28 PAR SAR (9) ↓ 1687.35 EMA (20) ↑ 1661.62 EMA (50) ↓ 1676.73. Range today is 1660 -1680 If gold can hit 1686 it signal to Bull. Target 1698 If can past 1700 i assume 1720 NeXT. But If gold below 1680 it can be strong to target Down area again
RANGE 1640.00 - 1665.00
Resistance Level Support
1 1620.00 1685.00
2 1600.00 1700.00
INDICATOR VALUE
Stoch (14) ↓ 60.28 down key
RSI (14) ↓ 47.44
MACD (9) -8.55 ↑
PAR SAR (9) 1685.86 ↓
EMA (20) 1661.18 ↑
EMA (50) 1675.95 ↓
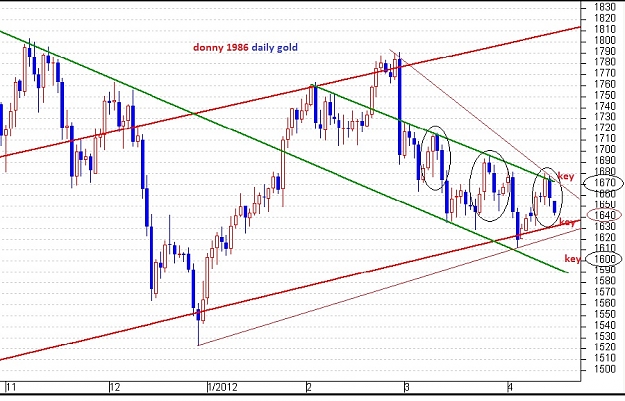
Chance to open the short-term reversal signal is still there
but the momentum weakened after the price is not capable of
breakout of the downtrend channel, although it has supported
by impersif gain since the beginning of the month. Thus, during the
gold prices move below the trendline 3, a line drawn from
some of the top level since early February, then the motion
prices will tend to continue the pattern of negative
downtrend channel with $ 1600 to support the key.
Stoch (14) ↑ 60.73
RSI (14) ↓ 45.99
MACD (9) -8.30 ↑
PAR SAR (9) 1684.39 ↓
EMA (20) 1660.25 ↓
EMA (50) 1674.99 ↓
As mentioned in last week that gold prices likely
closest to reaching the target resistance trendline above (figure
4). And those expectations are met. But need additional indicator
as an initial cue to match the pattern of late December 2011 and,
for example the ability to penetrate the gold 1700 level.
Gold has two possibilities, 1) reduction in support will be captured pd
the major trendline and the new one will recoup (back cover)
TSB attenuation and return to the area in 1670's. 2) Gold will try to test
or even a break-out (penetrate) 1 and the new trendline will recoup the
minimum position in 1650.
gold stil in consolidation down if hit 1660 signal up r2
if hit 1642 signal down S2
Although no new major developments are fundamental
happening in the market last weekend, the debt crisis of the European Union continues to
heats up. Spanish bond yields rose above 6% on Monday,
ahead of the two Italian bond auction this week. If bond yields
rise above 7%, is likely to re-place the debt crisis
EU in the primary focus in the market. Such concerns have
market place in a state of little "risk off" in
mentality on Monday, which hit most of the market
raw commodities including precious metals.
Weekend meeting between United Nations and Iran regarding the program
nuclear Iran has indeed been the case with both parties agree
to discuss it further in May
future. The market read this as bearish for oil
raw.
The trade of precious metals this week will also focus on
U.S. economic data coming out after a weekly progress
of the data Monday showed some weakness, which also
contributed to the attitude of "risk off" from the merchant.
Gold trading is likely to remain thin, nervous and jumpy, with prices expected to move lower from current levels
Physical buying in Asia are still lacking and positive addition to the delivery of Spanish bond auction today, the euro and the euro zone is still far from being safe
personal negative picture of the situation in Europe and probably the factor that gold will still be moving correlation with the euro, I expect prices to modestly this week
REVIEWS
Short Medium Long
Neutral Neutral Bullish
RANGE 1630.00 - 1665.00
Resistance Level Support
1 1620.00 1685.00
2 1600.00 1700.00
INDICATOR VALUE
Stoch (14) ↑ 63.06
RSI (14) ↓ 45.58
MACD (9) -8.12 ↑
PAR SAR (9) 1682.95 ↓
EMA (20) 1659.26 ↓
EMA (50) 1674.01 ↓
There was no sign the trend despite a mild rebound, this
because the character of the gold still in sideways, which
can mean the chance of gain and the correction was relatively the same.
Trendline 1 will be the closest support trendline while the 4
be resistant in this week. Gold is likely to
pattern matching the end of December if it is able to penetrate
minimum level of 1700. As long as it is not met, then the estimated
just moved in down-channel pattern (gap between the trendline
3 and 4 as illustrated below). Meanwhile, gold has 2
possibilities, 1) correction and restrained in a new trendline will
recoup the 1670's. 2) break-out and recoup trendline 1 to 1650.
Risk appetite in the market has increased on Tuesday.
Successful implementation of the Spanish bond auction and some of the data
a stronger economy came from Germany. That pushed the market
European stocks, and in turn support the U.S. stock indices and
commodity markets. However, the common sense of the market is that
The U.S. economy, the EU and China has changed a bit more wobbly
in recent weeks. It gives a bearish element
for the underlying stock and commodity markets.
Reports from the IMF warned Tuesday that the crisis
EU debt and financial crisis will be very difficult to
repaired and may lead to deflation in the EU economy
has pushed gold prices to trade unchanged at
Tuesday morning. Deflation is the main enemy of the gold commodity market
and others.
The U.S. dollar index traded steady to be weakening day
Tuesday because the trade had become choppy. Bulls and
bears from the greenback is struggling to gain control
short-term technical, which is still not a lot has
of success.
Crude oil futures traded more solid
high on Tuesday, which is a bullish factor for precious metals.
However, Nymex crude oil futures remained in
downtrend on the daily bar chart.
Reports last night said the demand for physical gold in
India fell about 50% of the levels seen last year at the time
this. India became a key festival next week, before the celebration,
retail gold demand usually increases.
market sentiment remained cautious ahead of U.S. Federal Reserve's policy meeting next week, after comments from Fed in recent weeks has led to sharp price fluctuations.
Add a note of prudence about the concerns about the Spanish finances. Although Spain has managed to exceed its sales target bonds at auction Tuesday, but was forced to pay a higher premium compared to the previous month, giving concern about long-term bonds on Thursday.
Gold edged up on Wednesday after the Spanish debt auctions have reduced concerns about euro zone debt crisis, but gains were capped as the euro is still under pressure ahead of the long-term bonds in Madrid this weekend.
Investors brushed off the negative news about the weak performance of manufacturing output and housing start lower than expected in the U.S. because of the financing of debt relief and the shock of the Spanish German business sentiment surges that raise equity and other risky assets
INDICATOR VALUE
Stoch (14) ↓ 44.54
RSI (14) ↑ 43.66
MACD (9) ↓ -8.75
PAR SAR (9) 1680.16 ↓
EMA (20) 1656.01 ↓
EMA (50) 1671.49 ↓
It is estimated there has been no change in outlook in this session, after
Gold prices could test major support trendline 1, pushing
idea that gold will move down-channel patterns (slit
trendline between 2 and 3) as illustrated above. On the other hand, remains
must be addressed more carefully because the trendline 1 is also potentially
through which the technical correction signal confirms that more
and change in short-term signals to be bearish.
If the session is transparent minimum 1630's, then the target correction
Nearby is the trendline 1600 or 2. Meanwhile, opportunities for
closed back (recoup) the correction, at least to the level
1650-s, would occur after reaching the trendline 2.
INDICATOR VALUE
Stoch (14) ↓ 42.31
RSI (14) ↑ 43.60
MACD (9) ↓ -8.62
PAR SAR (9) 1678.72 ↓
EMA (20) 1646.36 ↓
EMA (50) 1654.28 ↓
Last week gold moved in negative territory and was followed by
testing the major support trendline 1. This condition is
leaving a negative image that can be continued in sessions
this week. As described at the beginning of this week's outlook
that gold has two possibilities, namely a> correction will
stuck on the trendline and then recoup a minimum to
trendline resistance 3, or 2> 1 and proceed through the trendline
with a correction to a new area and recoup 1600 min to 1650's.
It should be an early indicator for the first possibility is at least
Earlier this week gold is able to survive in the 1660's.
INDICATOR VALUE
Stoch (14) ↓ 38.76
RSI (14) ↑ 43.81
MACD (9) -8.83 ↑
PAR SAR (9) 1676.18 ↓
EMA (20) 1651.96 ↓
EMA (50) 1667.97 ↓
Rebound in session yesterday was not enough to restore the suggestion
negative when the price of gold through the moment the major support trendline A. In addition, gold is also likely to improve the pattern
down-channel was formed by the trendline 2 and 3. This means that the signal
oversold (oversold) will appear when the price has been reached
The 1600s.
There was no change in support and resistance, which is still in the 1620's and
1650-s. If the session times stronger penetration occurs (generally shown
with a long white candle) until 1650 they will be resistant to penetrate, then
for short-term bullish going strong. These cues truth has been supported
the existence of a positive divergence on Stochastic Osc.
Gold prices rose in
trading Tuesday, following gains in equity markets and metals
industry, but the selling pressure ahead of the benefit limit
expiration of options contracts to the uncertainty over the U.S. and
U.S. Federal Reserve policy meeting.
Bullion, which most of this year has been followed
movement of risky assets, rose after U.S. equities rose in the middle
strong earnings performance of companies on board and
home sales reports are encouraging. The rally in copper prices
also raised the price of gold.
Trading volume is below average for the third time,
because investors are still waiting for the Fed announced the results of the meeting
policy on Wednesday from a two-day meeting.
INDICATOR VALUE
Stoch (14) ↓ 38.76
RSI (14) ↑ 43.81
MACD (9) -8.83 ↑
PAR SAR (9) 1676.18 ↓
EMA (20) 1651.96 ↓
EMA (50) 1667.97 ↓
Rebound in session yesterday was not enough to restore the suggestion
negative when the price of gold through the moment the major support trendline
[color="Red"]A. In addition, gold is also likely to improve the pattern
down-channel was formed by the trendline 2 and...
Resistance Level Support
1 1620.00 1680.00
2 1600.00 1700.00
INDICATOR VALUE
Stoch (14) ↑ 42.95 up
RSI (14) ↑ 49.94
MACD (9) -7.06 ↑
PAR SAR (9) 1673.66 ↓
EMA (20) 1651.66 ↓
EMA (50) 1666.60 ↓
1 can be assumed to support trendline tested sufficiently to dampen
correction that appears, is evidenced by the price reversal
occurs repeatedly, particularly since the beginning of this year. though
Thus, as long as prices do not stay away from this support, it would be
vulnerable if there is a decrease due to be potentially quite
extreme, the minimum target is the 1600's. some of the possibilities
can occur with the position of the current price. Gold can start
relinya if this weekend's session can be penetrated with a strong 1660.
Or just going to move to follow the down-channel with a range
trendline between 2 and 3. Also potentially bullish for gold
Stochastic Osc pd positive divergence. since early April.
STILL CONSOLIDATION UP TREND BUT STIL HAVE CORRECTION
Comex gold futures prices
end the trading session Thursday in the U.S. with solid increases in
near its highest intraday session and hit a two-week
new highs. Action of short covering and bargain hunting interest
selling pressure following the latter being the main trade fikur
Thursday. The weakening U.S. dollar and rising oil price index
also supports raw precious metals market
There are no new major developments coming from the crisis
EU debt and on Thursday, but other economic reports
published still show an impairment of performance. The European Union
economy is in recession, which makes the control problem of debt
to be very difficult. It is estimated that each increase
significant in the debt crisis of the European Union will make bullish for
the gold market as a safe haven.
INDICATOR VALUE
Stoch (14) ↑ 55.34
RSI (14) ↑ 52.59
MACD (9) -5.30 ↑
PAR SAR (9) 1672.32 ↓
EMA (20) 1651.40 ↓
EMA (50) 1648.39 ↓
1 can be assumed to support trendline tested sufficiently to
correction of existing stem. If diruntut of historical,
1 This trendline has been arrested over 10 times the rate of price decline
of gold. Thus, in this week's gold price likely
relative will record rally (weekly) with the support trendline 1
will escort him. Due to recent price closer to
The major support, it should be more careful because
potential to evoke an image of a significant decline.
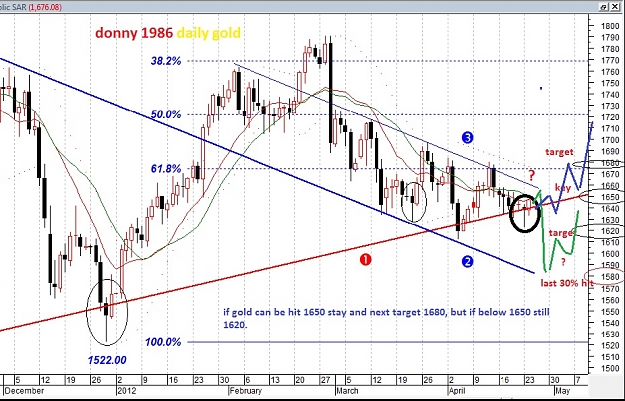
3 as a resistance trendline last week finally penetrated to
second time, so if gold in this week's break-out 1675
then the target is estimated to exceed the scale of the increase is 50.0% Fib.
RANGE 1660.00 - 1680.00
Resistance Level Support 1 1640.00 1700.00
2 1620.00 1720.00
INDICATOR VALUE Stoch (14) ↑ 66.01
RSI (14) ↑ 53.61
MACD (9) -3.96 ↑
PAR SAR (9) 1671.24 ↓
EMA (20) 1653.81 ↑
EMA (50) 1666.36 ↑
Gold prices bounced off major support (trendline 1), confirms
The first possibility is never discussed in the technical review
earlier that the golden opportunity was stuck on a trendline
and then emerging rebound or recoup. As for
which the second possibility, the gold correction also failed a test or even
through the 1620 to detect further bearish.
Thus, the minimum target for the increase in estimated
close the cumulative correction (recoup) is in the area 1680. while
next target was the 1700s, is based on the target increases
through the trendline as gold in the period 4 February 2012 and
(note the circled above).
Gold prices rose slightly on the day
Monday on better technical outlook after rising last week
ago, but the precious metal finish April with a loss
small in a fairly narrow trading range.
Bullion fell about 0.3 percent in April, posting a
The third consecutive monthly decline for the first time since
year 2000. Seraingkain strong U.S. economic data has been
dims hopes for the continuation of monetary easing
by the Federal Reserve to reduce investment appetite for metals
noble.
1660.00 - 1680.00
Resistance Level Support
1 1640.00 1700.00
2 1620.00 1720.00
INDICATOR VALUE
Stoch (14) ↑ 66.01
RSI (14) ↑ 53.61
MACD (9) -3.96 ↑
PAR SAR (9) 1671.24 ↓
EMA (20) 1653.81 ↑
EMA (50) 1666.36 ↑
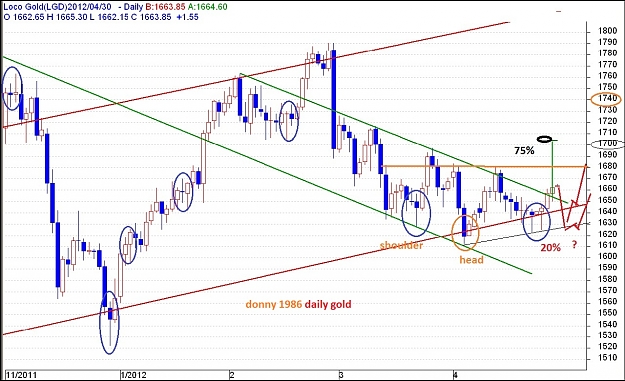
Entering the second day this week the price of gold began to show
positive signs, though still weak due to test trendline 1
Monday. However, with his last position at this time, gold is quite
mensugestikan strong bullish if it is able to penetrate the resistant
Nearby, the 61.8% Fibonacci retracement scale (1675's).
Meanwhile, the target is estimated to exceed 1720 relinya's who
targets are based on the rally at week 3 February period
who was able to record a cumulative gain of nearly 50 points
(note the forecast in the illustration below). Even so,
as long as prices do not stay away from major support, trendline 1, it remains
need to be considered.
S2 S 1 Pivot Point R1 R2
1649.27 1655.78 1663.72 1670.23 1678.23