Support Resistance Level
1 1580.00 1640.00
2 1560.00 1660.00
INDICATOR VALUE
STOCH (14) ↑ 75.64
RSI (14) ↑ 57.76
MACD (9) ↑ 5.71
PAR SAR (9) 1625.66 ↓
EMA (20) 1607.70 ↑
EMA (50) 1603.60 ↑
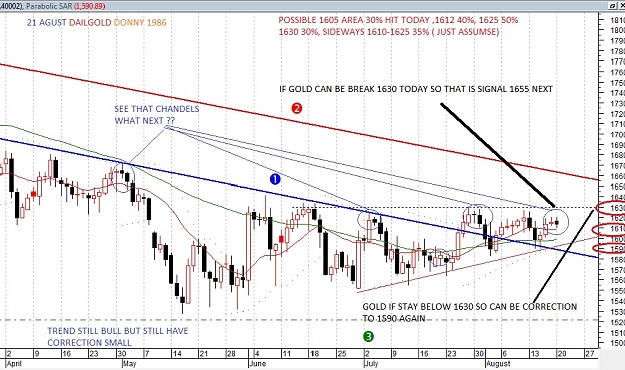
In initiating movement this week, the rate of increase
sustained rally earlier period seems weak. Although there
gain arising, probably only reach nearest resistance
in the highest average 2.5 months in 1630-an. And will be
corrected back to the minimum passing level the 1600s, the
level that is often used to detect the price trend.
Meanwhile, the consolidation pattern that has been is suggested since the early
July is estimated to potentially proceed. Some sentiment
which usually affects the gold price significantly, could
assumed to present no significant effect, or the
In other words neutral cues.
TIPS: WARNING MUST SEE CHANDELS UPDATE AND NEWS
BUY 1612-1614 TARGET 1-5 POINTS
SELL 1628-1630 TARGET 1-3 POINTS
DATA NEWS CONCLUSION
European Central Bank is considering
place limits on the state EU peripheral bond yields
Europe. It is pushing the yield (yield) bonds of Italy and
Spain is slightly down, but pushed a little increase in returns
German bond yields. From the report it is said that the ECB
will buy the bonds of euro member states when the yield
(yield) exceeded a certain level. However, there is also a report
that the German Bundesbank officials said they did not
agrees with the idea.
The U.S. dollar index is trading slightly lower on Monday.
Greenback relatively choppy trading lately, but the power
still maintain a bullish short-term technical advantage.
Meanwhile, crude oil prices fell on Monday as
profit-taking after prices hit a new high since
three months earlier. However, oil still has
short-term upside technical momentum. Precious metals markets will
continue to look closely at how the trade of the two key
"outer market" daily.
1640.00 - 1670.00
Support Resistance Level
1 1620.00 1690.00
2 1600.00 1710.00
INDICATOR VALUE
STOCH (14) ↑ 91.75
RSI (14) ↑ 68.72
MACD (9) ↑ 9.52
PAR SAR (9) 1590.88 ↑
EMA (20) 1614.57 ↑
EMA (50) 1606.81 ↑
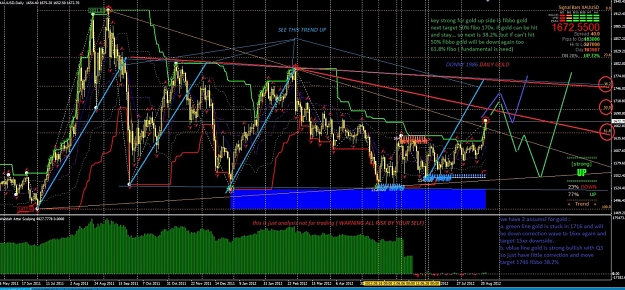
Expectations that gold prices were likely retained on
1630s levels, failed to be realized. Prices unexpectedly
continued potential to lead to resistant rally nearest
trendline 2 1660 area). Highest level also
surpassed the highest recorded in the period June.
So from this condition, gold in a state of strong bullish
with a target gain is expected to position the 1660s.
Exposure to above is expected to be realized if the session today
gold prices were able to survive in the 1640's. But if not,
then gold also has the opportunity to correct the form
balance after cumulative gain significantly.
Alpha
RANGE 1665.00 - 1680.00
Support Resistance Level
1 1640.00 1700.00
2 1620.00 1710.00
INDICATOR VALUE
STOCH (14) ↑ 94.42
RSI (14) ↑ 72.59
MACD (9) ↑ 12:47
PAR SAR (9) 1593.48 ↑
EMA (20) 1619.81 ↑
EMA (50) 1609.27 ↑
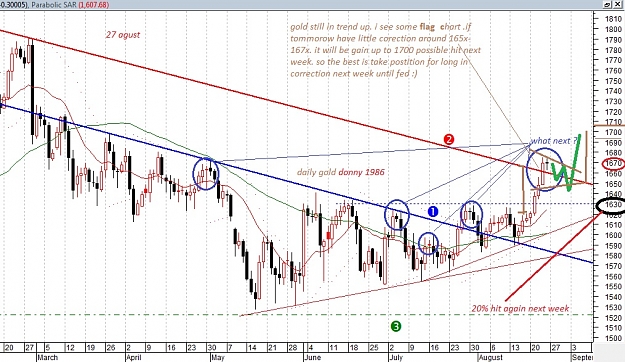
Target resistant to the 1660s has been exceeded, so that this condition
has confirmed a very strong bullish. And do not close
Gold likely will enter the consolidation area ever
showed in the period from March to April and the average
highest at the position the 1700s. Opportunities will be open if
minimum in this session closes above 1660 or trendline 2.
Meanwhile, the pattern shown rally happens serially
(7 consecutive periods) is for the first time in
this year. Tracing patterns rally like this, especially during
From January, the power of gold to rise has been successfully
entered the area over the 1700s.
[center]Alpha
RANGE 1665.00 - 1680.00
Support Resistance Level
1 1640.00 1700.00
2 1620.00 1710.00
INDICATOR VALUE
STOCH (14) ↑ 94.42
RSI (14) ↑ 72.59
MACD (9) ↑ 12:47
PAR SAR (9) 1593.48 ↑
EMA (20) 1619.81 ↑
EMA (50) 1609.27 ↑
Target resistant to the 1660s has been exceeded, so that this condition
has confirmed a very strong bullish. And do not close
Gold likely will enter the consolidation area ever
showed in the period from March to April and the average
highest at the position the 1700s....
RANGE 1640.00 - 1670.00
Support Resistance Level
1 1620.00 1680.00
2 1600.00 1700.00
INDICATOR VALUE STOCH (14) ↓ 92.21watch
RSI (14) ↓ 72.28
MACD (9) ↑ 14:05
PAR SAR (9) 1607.68 ↑
EMA (20) 1624.42 ↑
EMA (50) ↓ 1601.44
At last Friday's session, gold rally stalled from phase has
started since mid-August, and a series of gain
longest especially for this year. The increase can be
assumed to be quite remarkable has penetrated a number of resistant
important that always put a halt to the rise in gold in 3 months
Finally, as the trendline from the highest average in 1630 or
trendline 2.
Although there are sometimes long rally after the corrections, it
fair enough. Gold will remain in the position it is still too early
gold will have a correction, unless there are indicators for
detect, for example, two early period trendline break 2 more gold.
1640.00 - 1670.00
Support Resistance Level
1 1620.00 1680.00
2 1600.00 1700.00
INDICATOR VALUE STOCH (14) ↓ 88.51
RSI (14) ↑ 69.67
MACD (9) ↑ 16.60
PAR SAR (9) 1608.88 ↑
EMA (20) 1631.87 ↑
EMA (50) 1615.73 ↑
Gold slowly began to slacken, the positive potential possessed
since 2 weeks in a row has not been strong enough to follow up.
Break-high to a level of 1677's and then closed at its intraday
Her low-gold reflects conditions that may imply
overbought, though still very weak. Only after
Gold is able to penetrate trendline 2, which is now the support,
expected to be a strong signal attenuation.
The reaction in the form of correction is still quite reasonable after rally
length. But keep in mind when the golden age
this session to offset correction yesterday, the resistance in
1700 will re-open.
1640.00 - 1670.00
Support Resistance Level
1 1620.00 1680.00
2 1600.00 1700.00
INDICATOR VALUE
STOCH (14) ↓ 82.73
RSI (14) ↓ 62.93
MACD (9) ↑ 16:32
PAR SAR (9) 1614.33 ↑
EMA (20) 1634.15 ↑
EMA (50) 1617.30 ↑
The possibility of no change in outlook on the session,
considering the price moves tend to be flat, mensugestikan
performance of gold began to slacken, the positive potential possessed
since 2 weeks in a row has not been strong enough to follow up.
Break-high to a level of 1677's that then not be confirmed by
price position above the 1670's, chances are overbought. If gold
able to penetrate the second trendline, now support,
estimated signal attenuation will be strong.
In this session, gold today does not show a positive reaction and
fails to close prior period corrections, so that resistance in
1700 in the near future is rather difficult to achieve.
S2 S1 Pivot Point R1 R2
1641.48 1648.67 1659.28 1666.47 1677.08
Support Resistance Level
1 1680.00 1740.00
2 1660.00 1760.00
INDICATOR VALUE
STOCH (14) ↑ 83
RSI (14) ↑ 72
MACD (9) ↑ 18
PAR SAR (9) 1639.46 ↑
EMA (20) 1643.20 ↑
EMA (50) 1608.33 ↑
Gold unexpectedly soared up through the period of highest
earlier in the session last week and managed to
high of 1692.90, a new highest found in
The last 5 months. Technically, this condition will generally
encourage a strong bullish picture, especially short term,
and potentially achieve a number of important resistance next.
Meanwhile, look at the pattern seen in the period of January,
horizontal trendline after breaking through in 1680's, gold has
rally strong to be able to go beyond the psychological level next
1700s (note the circled below). Similarly
at current gold position, its minimum gain is in 1730.
INDICATOR VALUE STOCH (14) ↑ 91.17 watch over
RSI (14) ↑ 72.52
MACD (9) ↑ 19.65
PAR SAR (9) 1630.85 ↑
EMA (20) 1646.29 ↑
EMA (50) 1624.41 ↑
Although less impressive start this week, does not mean
potential gain that owned the biggest intraday rally since the end of the week
ago, has faded. Due to the technical strength of the rally
still allowed to continue, beyond the minimum level
important, namely 1700. If we observe the illustration below, the gold
likely to reach the target level to 1730's, the results
projection of the slit width down-channel.
As in some outlook ago, linked the
phenomenon penetration level of support or resistance, which is generally
hinted trend assertion. During the break-out,
the positive or negative direction, increasingly confirmed.
RANGE 1690.00 - 1720.00
Support Resistance Level
1 1680.00 1740.00
2 1660.00 1760.00
INDICATOR VALUE
STOCH (14) ↑ 97.55
RSI (14) ↑ 73.37
MACD (9) ↑ 20.95
PAR SAR (9) 1638.60 ↑
EMA (20) 1651.03 ↑
EMA (50) 1627.22 ↑
No significant change in outlook, gold started
This week was less impressive, but it does not mean the potential
owned gain the biggest intraday rally since the end of last week,
been lost. Technically still allowing the rally will
continue, at least through the level of 1700. From the illustration below,
Gold has a chance to reach the target level to 1730's,
ie the projection of the slit down-channel.
Gold in the afternoon session barely penetrate the psychological level of 1700,
illustrates that he is trying to achieve, although
tests are only momentary. However, this test will
confirm the strength of the short-term bullish.
S2 S1 Pivot Point R1 R2
1683.01 1689.51 1694.31 1700.81 1705.61
RANGE 1720.00 - 1750.00
Support Resistance Level
1 1700.00 1760.00
2 1680.00 1780.00
INDICATOR VALUE STOCH (14) ↓ 92.37 ohhhh
RSI (14) ↑ 73.40
MACD (9) ↑ 22:30
PAR SAR (9) 1654.35 ↑
EMA (20) 1659.40 ↑
EMA (50) 1632.59 ↑
Currently, the trend in the medium term has been switched to bullish
after gold managed to surpass 1700 easily, is
second time into the psychological level this year.
So, do not rule out the rally will be stronger and
potentially resume next week. Notice in the illustration
below, gold is expected to try to chase the target projection of
down-channel line, ie, in the 1730's in the near future.
From the historical side, gold has a great opportunity to follow a pattern like that
occurred in January, the time it reached its highest level in
area in 1760's and reached quite intensive. For the position of the current gold
This opportunity is now increasingly open.
S2 S1 Pivot Point R1 R2
1678.45 1689.80 1701.95 1713.30 1725.45
Support Resistance Level
1 1720.00 1760.00 2 1700.00 1780.00 LAST TARGET
INDICATOR VALUE STOCH (14) ↑ 91
RSI (14) ↑ 80
MACD (9) ↑ 25
PAR SAR (9) 1673.40 ↑
EMA (20) 1676.42 ↑
EMA (50) 1620.92 ↑
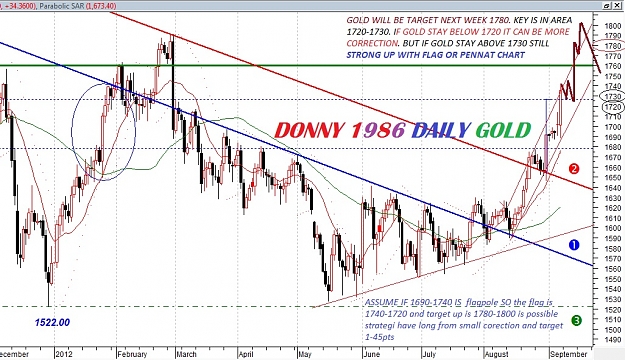
1725 projection level is taken from the wide gap between the trendline 1
and 2 (down-channel line) finally managed to penetrate. this analysis
relevant enough to be used since gold has penetrated
important resistance trendline 2 form at the end of August.
Moreover, the pattern of strong penembusannya category usually
indicated by the form of long white candle. Chance of euphoria
This will still be felt at the beginning of this week, so it does not shut down
possibility nearest resistance in 1760's will be tested.
The above figures are based on patterns shown on the rally
January last period where gold was able to strengthen the
in a row to level 1760.
SEE PIC COMPLETE SAY YOUR FRIEND TO TAKE MORE PROFIT HEHE
NB: IF YOU ALWAYS SEE MY PIC AND ANALYSIS EVERY DAY SO YOU CAN SEE ,WHERE IS THE GOLD WILL BE MOVED. SO STILL WATCH THE ANALYSIS