



Japanese Candlestick Charts are the cornerstone of price action analysis in financial markets and form a fundamental component of forex education . These charts provide an intuitive visual representation of price movements, displaying the open, close, high, and low within a given timeframe.
TP & SL Tool: Risk Reward Ratio Calculator RRR MT4 | Prop Firm Protector: Trade Assist Prop Firm Plus TF Expert MT4 | Money Management + DrawDown Protector: Trade Panel Prop Firm Drawdawn Limiter Pro MT4 |Get a free Expert Advisor license via Telegram and WhatsApp
What sets candlesticks apart is their ability to capture market psychology—each candle tells a story of the battle between buyers and sellers. The body reflects dominance (bullish or bearish), while the wicks (shadows) reveal volatility and rejected price levels.
Candlestick patterns are universally applied across Forex, stocks, cryptocurrencies, and commodities, making them essential for traders in all markets and timeframes.
Why Candlestick Patterns Matter in Trading
Candlesticks compress critical market data into a single visual element, allowing traders to quickly assess:
 Market sentiment (bullish vs. bearish momentum)
Key support/resistance levels (based on wick rejections)
Potential reversals or continuations (through multi-candle formations)
Their simplicity and effectiveness make them a preferred tool for price action traders who rely on raw market structure rather than lagging indicators.
Strengths and Limitations of Candlestick Analysis
Key Advantages
Quick identification of trend shifts – Patterns like engulfing or doji signal reversals early.
Works across all timeframes – Scalpers and swing traders can apply the same principles.
No reliance on complex indicators – Pure price action reduces analysis paralysis.
Aligns with supply & demand zones – Enhances confluence for high-probability trades.
Potential Drawbacks
 False signals in choppy markets – Requires additional confirmation (e.g., volume, trendlines).
Less reliable on ultra-low timeframes (e.g., 1-minute charts due to noise).
Experience needed for accurate interpretation – Misreading patterns leads to poor decisions.
Practical Applications of Candlestick Patterns
Candlestick analysis enhances trading strategies by:
TP & SL Tool: Risk Reward Ratio Calculator RRR MT4 | Prop Firm Protector: Trade Assist Prop Firm Plus TF Expert MT4 | Money Management + DrawDown Protector: Trade Panel Prop Firm Drawdawn Limiter Pro MT4 |Get a free Expert Advisor license via Telegram and WhatsApp
What sets candlesticks apart is their ability to capture market psychology—each candle tells a story of the battle between buyers and sellers. The body reflects dominance (bullish or bearish), while the wicks (shadows) reveal volatility and rejected price levels.
Candlestick patterns are universally applied across Forex, stocks, cryptocurrencies, and commodities, making them essential for traders in all markets and timeframes.
Why Candlestick Patterns Matter in Trading
Candlesticks compress critical market data into a single visual element, allowing traders to quickly assess:
Market sentiment (bullish vs. bearish momentum) Key support/resistance levels (based on wick rejections) Potential reversals or continuations (through multi-candle formations)Their simplicity and effectiveness make them a preferred tool for price action traders who rely on raw market structure rather than lagging indicators.
Strengths and Limitations of Candlestick Analysis
Key Advantages
Quick identification of trend shifts – Patterns like engulfing or doji signal reversals early.
Works across all timeframes – Scalpers and swing traders can apply the same principles.
No reliance on complex indicators – Pure price action reduces analysis paralysis.
Aligns with supply & demand zones – Enhances confluence for high-probability trades.
Potential Drawbacks
False signals in choppy markets – Requires additional confirmation (e.g., volume, trendlines). Less reliable on ultra-low timeframes (e.g., 1-minute charts due to noise). Experience needed for accurate interpretation – Misreading patterns leads to poor decisions.Practical Applications of Candlestick Patterns
Candlestick analysis enhances trading strategies by:
- Identifying supply/demand zones – Clusters of candles highlight key liquidity areas.
- Generating entry/exit signals – Pin bars at support/resistance act as high-probability triggers.
- Detecting stop hunts & liquidity grabs – Long wicks indicate potential traps.
- Confirming breakouts – Engulfing patterns validate trend continuations.
- Reflecting market psychology – Doji candles show indecision before reversals.
Popular Candlestick Patterns
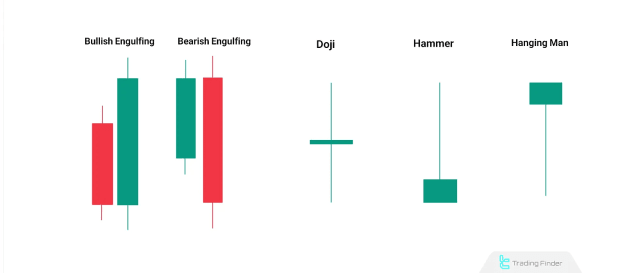
- Doji (Indecision)
- Hammer & Hanging Man (Reversal signals)
- Engulfing Patterns (Strong momentum shifts)
- Morning Star & Evening Star (Multi-candle reversal setups)
How to Read a Candlestick Chart
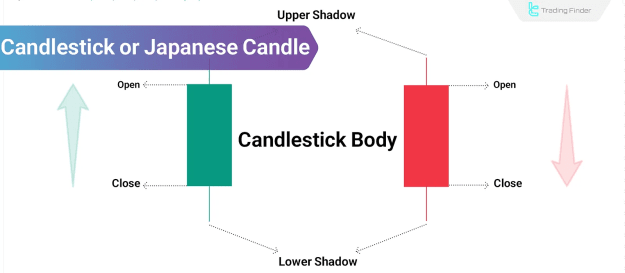
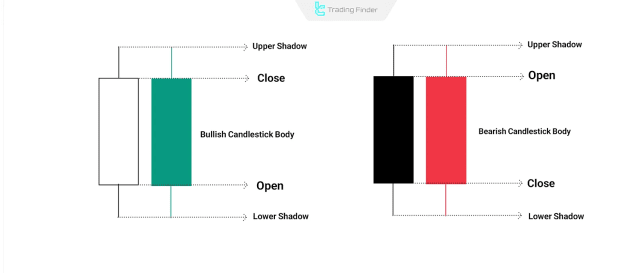
Each candle consists of:
- Open & Close (Body) – Determines bullish (green/white) or bearish (red/black) bias.
- High & Low (Wicks/Shadows) – Shows price rejection and volatility.
Example:
- A long bullish candle indicates strong buying pressure.
- A small-bodied candle with long wicks suggests market indecision.
Candlesticks are effective on any timeframe, from 1-minute charts for scalping to daily/weekly charts for swing trading.
Conclusion: Mastering Candlestick Analysis
Japanese Candlesticks are more than just price charts—they are a window into market psychology. By learning to interpret these patterns, traders can:
Spot high-probability trade setups
Avoid false breakouts
Improve risk-reward ratios
Attached Image(s) (click to enlarge)
Attached File(s)
