TP & SL Tool: Risk Reward Ratio Calculator RRR MT4 | Prop Firm Protector: Trade Assist Prop Firm Plus TF Expert MT4 | Money Management + DrawDown Protector: Trade Panel Prop Firm Drawdawn Limiter Pro MT4 |Get a free Expert Advisor license via Telegram and WhatsApp
What Are Dual Candlestick Patterns?
Dual candlestick patterns consist of two consecutive candles that together indicate shifts in market sentiment. Their interpretation relies on the position, size, and type of each candle in relation to the other.
Key Features
- Composed of two sequential candles
- Provide insight into potential trend reversals
- Require analysis within the broader market context
Types of Dual Candlestick Patterns
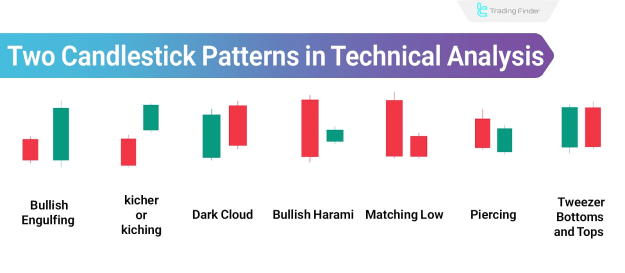
The most widely used dual candlestick patterns in financial market technical analysis include:
- Bullish Engulfing
- Bearish Engulfing
- Kicking (Kicher)
- Dark Cloud Cover
- Bullish Harami
- Bearish Harami
- Matching Low
- Piercing Pattern
- Tweezer Bottoms and Tops
Bullish Engulfing Pattern
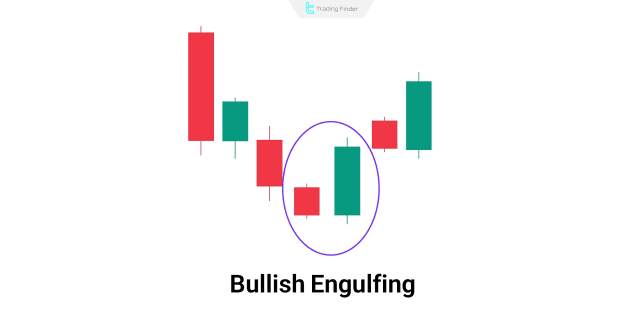
A Bullish Engulfing pattern signals a potential bullish reversal at the end of a downtrend.
Characteristics:
- Begins with a small bearish candle followed by a large bullish candle that completely engulfs it
- The signal’s reliability increases with a shorter first candle and a longer second candle
Bearish Engulfing Pattern
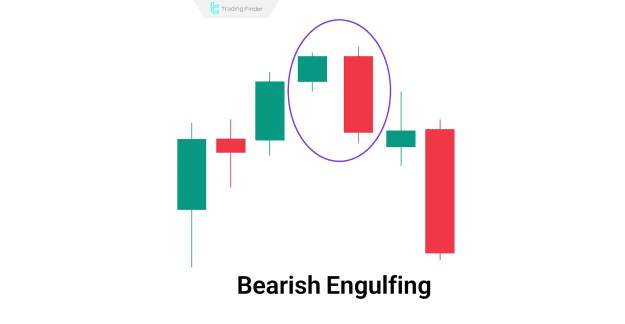
The Bearish Engulfing pattern indicates a possible bearish reversal, typically at the top of an uptrend.
Characteristics:
- First candle is bullish, followed by a strong bearish candle engulfing the previous candle entirely
- The smaller the first candle and the larger the second, the more powerful the signal
Kicking (Kicher) Pattern
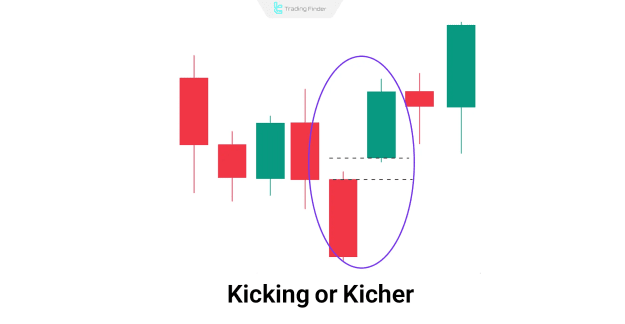
The Kicking pattern suggests a sharp market reversal, driven by a gap between two opposite candles.
Characteristics:
- First candle aligns with the existing trend
- Second candle is a strong opposite candle that gaps significantly up or down, highlighting a rapid market sentiment shift
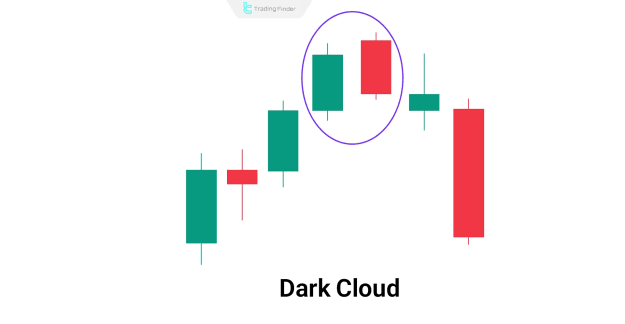
Dark Cloud Cover Pattern
Dark Cloud Cover is a bearish reversal pattern appearing after an uptrend, indicating strong selling pressure.
Characteristics:
- The first candle is bullish
- The second candle opens above the previous close but closes below the midpoint of the first candle
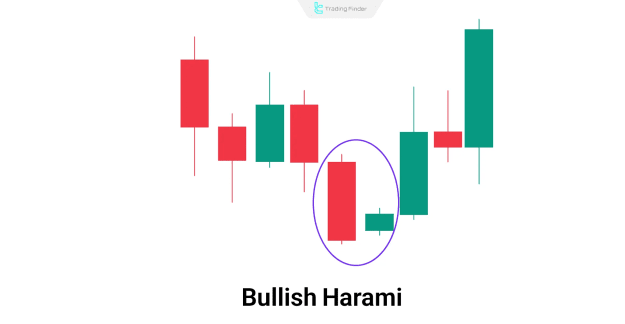
Bullish Harami Pattern
Bullish Harami signals a potential bullish reversal during a downtrend, though traders require further confirmation before entering positions.
Characteristics:
- Features a large bearish candle followed by a small bullish candle entirely within the first candle’s body
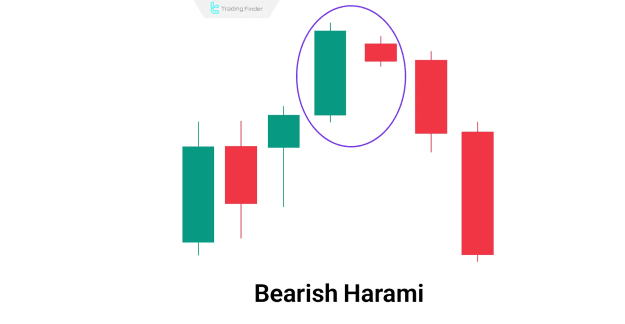
Bearish Harami Pattern
The Bearish Harami pattern indicates a bearish reversal, usually at the top of an uptrend.
Characteristics:
- A large bullish candle is followed by a small bearish candle contained within the first candle’s range, signalling reduced buying momentum
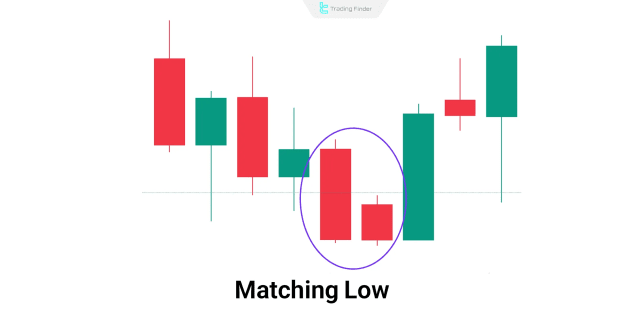
Matching Low Pattern
Matching Low suggests strong support levels and potential upward reversals in price.
Characteristics:
- Two bearish candles where the second opens higher but closes at the same level as the first, reflecting buyer support at that level
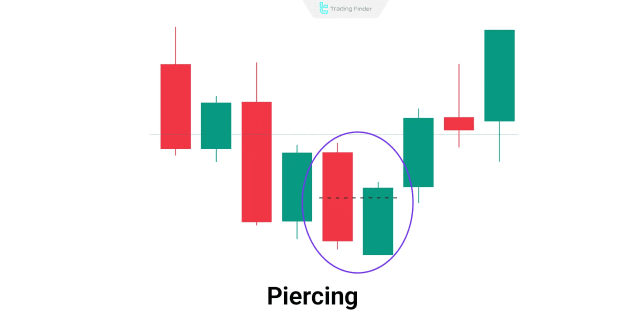
Piercing Pattern
The Piercing pattern signals a bullish reversal at the end of a downtrend.
Characteristics:
- First candle is bearish
- Second candle opens below the first candle’s close and closes above its midpoint, indicating a shift in buyer strength
Tweezer Bottoms and Tops Pattern
Tweezer patterns appear at market tops or bottoms, indicating potential reversals due to nearly identical highs or lows.
Characteristics:
- Tops: bullish candle followed by bearish candle with similar highs
- Bottoms: bearish candle followed by bullish candle with similar lows
Pros and Cons of Dual Candlestick Patterns
Advantages
- Identify potential trend reversals with clarity
- Enhance market forecasting and analysis
- Assist in confirming optimal entry opportunities
Disadvantages
- Lower predictive accuracy compared to multi-candle formations
- Require experience for precise interpretation
- Possibility of misreading signals in volatile market conditions
Comparison with Single and Triple Candlestick Patterns
Dual candlestick patterns provide a balance between speed and predictive strength. While single candlestick patterns offer quick but less reliable signals, triple candlestick patterns provide stronger confirmations but require more time to form. Dual patterns sit in between, offering moderate predictive power with reasonable identification time.
Conclusion
Dual candlestick patterns remain integral to technical analysis by signalling potential market reversals through two-candle formations. Successful implementation depends on trader expertise, contextual evaluation within broader market structures, and confirmation using complementary technical indicators to enhance decision-making accuracy.