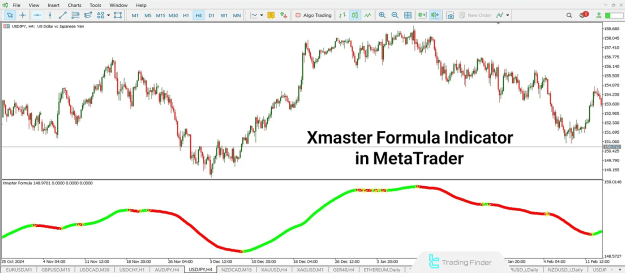
Xmaster Formula Indicators:
Xmaster Formula Indicator MT4
Xmaster Formula Indicator MT5
TP & SL Tool: Risk Reward Ratio Calculator RRR MT4 | Prop Firm Protector: Trade Assist Prop Firm Plus TF Expert MT4 | Money Management + DrawDown Protector: Trade Panel Prop Firm Drawdawn Limiter Pro MT4 |Get a free Expert Advisor license via Telegram and WhatsApp
Understanding the Xmaster Formula Indicator
The Xmaster Formula Indicator is a sophisticated technical analysis tool that leverages a combination of analytical algorithms to detect underlying price trends. Despite its advanced internal mechanisms, it is remarkably user-friendly and does not demand deep technical expertise. Its simplicity allows for easy configuration and adaptation to any timeframe and application across diverse financial markets.
The indicator's internal system is built upon a foundation of well-known technical tools, including Moving Averages (MA), the MACD indicator, and Bollinger Bands. These components work in synergy to more accurately identify support and resistance levels and potential price reversal points, providing traders with clearer insights into market dynamics.
Advantages and Disadvantages of the Xmaster Formula Indicator
Like any trading tool, the Xmaster Formula Indicator comes with its own set of strengths and weaknesses:
Advantages:
- User-Friendly Interface: The indicator is intuitive and easy to navigate, making it accessible even for beginners.
- Beginner-Friendly: Its straightforward design allows new traders to quickly grasp its signals and integrate it into their strategies.
- Suitable for Major Currency Pairs: It performs optimally when analyzing frequently traded major currency pairs.
- High Percentage of Reliable Signals: The indicator is known for generating a good number of accurate signals.
- Highly Flexible and Adaptable: It can be customized and adjusted to suit various trading strategies and market conditions.
Disadvantages:
- Few Signals: While reliable, the indicator may not generate a high volume of signals, requiring patience from traders.
- Requires Significant Patience: Due to the fewer signals, traders need to wait for optimal entry and exit points.
- Possibility of False Signals: As with all indicators, there is a risk of generating false signals, necessitating confirmation.
- Requires Signal Confirmation: It is recommended to use the Xmaster Formula in conjunction with other indicators to confirm signals and reduce the likelihood of false positives.
Key Features of the Xmaster Formula Indicator
The Xmaster Formula Indicator offers several notable features that enhance its utility for traders:
- Versatile Application: Usable for analyzing both major and minor currency pairs.
- Optimal Performance: Performs best during the London session, and also effectively usable in the New York session.
- Multi-Timeframe Support: Supports both long-term and short-term timeframes, offering broad applicability.
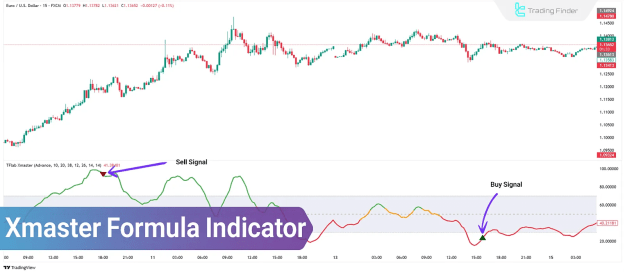
- Simple, Color-Coded Signals: Displays clear, intuitive signals (Green = Buy, Red = Sell) for easy interpretation.
- Diverse Trading Style Compatibility: Applicable for scalping, day trading, and swing trading strategies.
Overbought and Oversold Detection in the Xmaster Formula Indicator
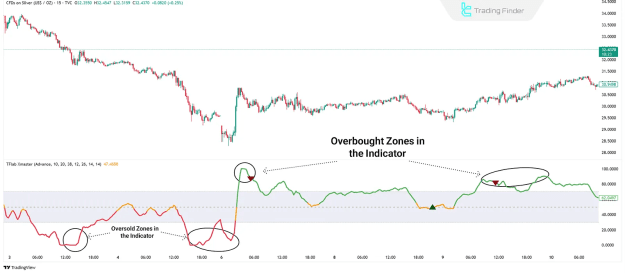
One of the primary functions of the Xmaster Formula Indicator is its ability to identify Overbought and Oversold zones. This feature is crucial for traders seeking to more accurately detect potential price reversal points:
- Overbought Condition: When the indicator turns red and appears at the top of the chart, it signifies an overbought condition. This suggests that the asset's price has risen too rapidly and may be due for a downward correction.
- Oversold Condition: Conversely, when the indicator turns green and appears at the bottom of the chart, it typically signals an oversold condition. This indicates that the asset's price has fallen excessively and could be poised for a potential upward move.
Key Notes for Using the Xmaster Formula Indicator
To maximize the effectiveness of the Xmaster Formula Indicator, traders should pay close attention to its color-coded lines:
- Red Line: Typically represents a sell signal.
- Green Line: Usually represents a buy signal.
It's worth noting that these colors can be customized in the indicator's settings to suit individual preferences.
Buy Rules Using the Xmaster Formula Indicator
To execute profitable buy trades using the Xmaster Formula Indicator, adhere to the following guidelines:
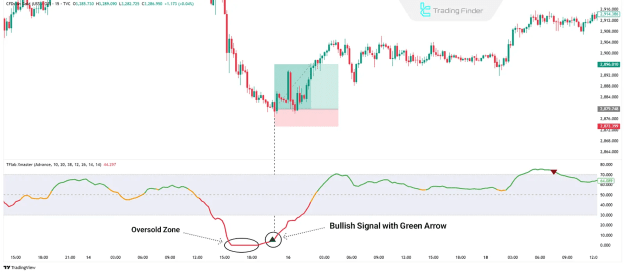
- Entry Signal: Enter a buy position when the indicator arrow turns green.
- Oversold Confirmation: The indicator line must be in the oversold zone to confirm the buy signal.
- Candlestick Confirmation: A strong bullish candlestick adds further reliability to the signal.
- Stop Loss Placement: Place the stop loss below the signal candlestick to mitigate potential losses.
- Profit Taking: Consider taking profit when the line turns yellow or encounters a resistance level.
Sell Rules Using the Xmaster Formula Indicator
For successful sell trades using the Xmaster Formula Indicator, follow these rules:
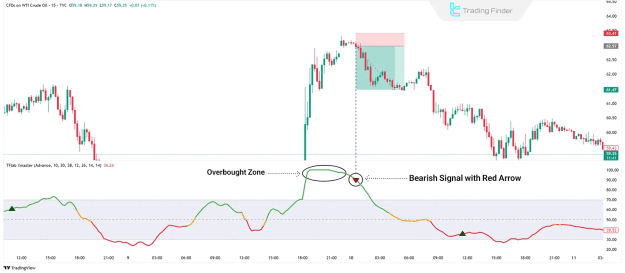
- Entry Signal: A red arrow from the indicator provides a sell signal.
- Overbought Confirmation: The line must be in the overbought zone to validate the sell signal.
- Candlestick Confirmation: A strong bearish candlestick confirms the sell signal.
- Stop Loss Placement: Place the stop loss above the signal candlestick to manage risk.
- Position Closure: Close the position when the arrow color changes or a support level is hit.
How to Install the Xmaster Indicator on MetaTrader
Installing the Xmaster Indicator on MetaTrader 4 (MT4) or MetaTrader 5 (MT5) is a straightforward process:
- Download: Download the XmasterFormula.ex4 (for MT4) or XmasterFormula.ex5 (for MT5) installation file.
- Launch MetaTrader: Open your MetaTrader platform.
- Navigate to Data Folder: Go to File > Open Data Folder.
- Locate Indicators Folder: Navigate to MQL4 (for MT4) or MQL5 (for MT5) > Indicators.
- Move Indicator File: Move the downloaded indicator file into the Indicators folder.
- Restart MetaTrader: Close and restart your MetaTrader platform to refresh the indicator list.
- Add to Chart: Add the indicator from the Custom Indicators section to your desired chart.
- Configure Settings: Finally, configure the settings based on your individual needs and trading style.
Conclusion
The Xmaster Formula Indicator stands as a valuable tool for identifying price trends and gauging current market sentiment. Its user-friendly design, adaptability across different timeframes, and free availability on platforms like TradingView and MetaTrader make it highly accessible. For enhanced accuracy and more reliable buy and sell signals, it is strongly recommended to use the Xmaster Formula Indicator in combination with other technical indicators, such as Bollinger Bands or Fibonacci retracement tools.