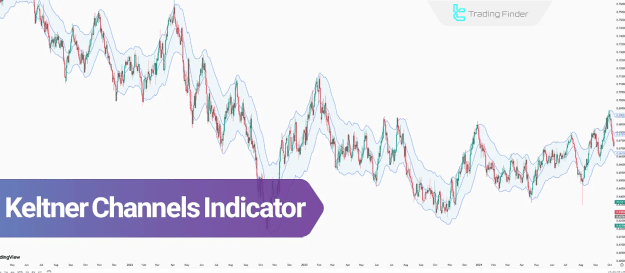
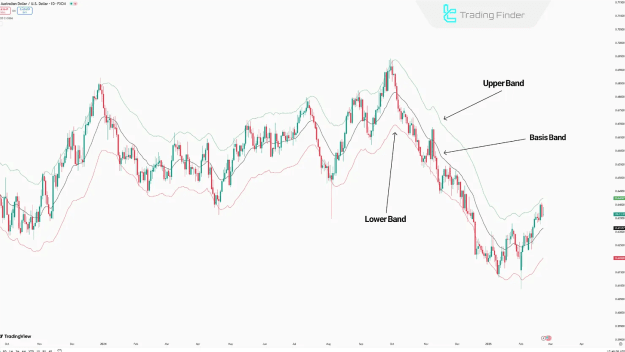
Components of the Keltner Channels Indicator:
- Middle Line (Basis Line): This central line, typically an EMA 20, represents the overall price trend and forms the core of the indicator.
- Upper Line (Upper Band): Functioning as a dynamic resistance level, a break above this line generally signals a bullish price movement.
- Lower Line (Lower Band): Acting as a dynamic support level, a break below this line typically indicates a bearish price movement.
TP & SL Tool: Risk Reward Ratio Calculator RRR MT4 | Prop Firm Protector: Trade Assist Prop Firm Plus TF Expert MT4 | Money Management + DrawDown Protector: Trade Panel Prop Firm Drawdawn Limiter Pro MT4 |Get a free Expert Advisor license via Telegram and WhatsApp
Keltner Channel Indicators:
Keltner Channel Indicator MT4
Keltner Channel Indicator MT5
Advantages and Disadvantages of the Keltner Channels
To effectively utilize the Keltner Channels, it's crucial to understand its strengths and limitations.
Advantages:
- Combines Trend and Volatility: It integrates EMA (trend) and ATR (volatility) for more accurate and comprehensive signals.
- Enhanced Stability: The Keltner Channels tend to be more stable than Bollinger Bands in highly volatile market conditions.
- Trend and Entry/Exit Identification: This indicator excels at identifying strong trends, as well as potential entry and exit points.
- Reduced Price Noise: Compared to similar technical indicators, it effectively reduces extraneous price noise, offering clearer signals.
Disadvantages:
- Suboptimal in Range-Bound or Low-Volatility Markets: Its performance can be limited in markets characterized by sideways movement or low volatility.
- Parameter Sensitivity: Optimal performance requires careful adjustment of its parameters to suit specific market conditions.
- Lack of Overbought/Oversold Signals: The Keltner Channels do not inherently provide clear signals for overbought or oversold market conditions.
- Delayed Reaction to Abrupt Changes: It may exhibit a slower reaction to sudden and significant price shifts.
Applications of the Keltner Channels
The Keltner Channels indicator leverages EMA and ATR to identify trends, pinpoint breakout signals, and determine optimal entry and exit points.
Using the Keltner Channels to Identify Trends:
One of the primary applications of the Keltner Channels is to ascertain the prevailing price trend, which is determined by how price interacts with the lines and moves within the channel.
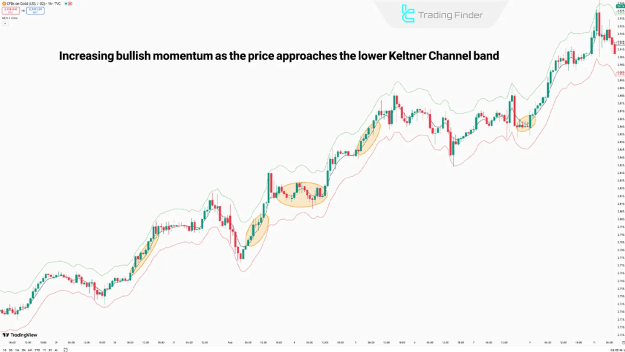
- Uptrend: In an uptrend, price typically moves between the Basis Band and the Upper Band, with the middle line acting as dynamic support.
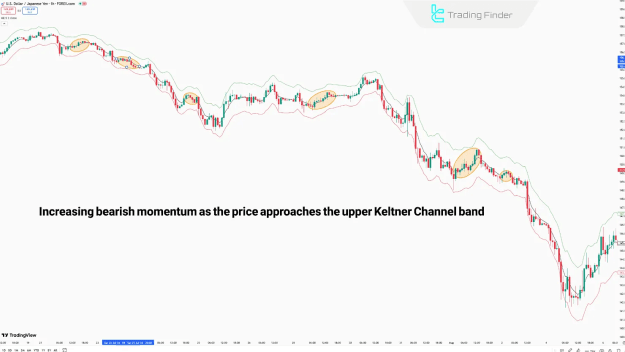
- Downtrend: Conversely, in a downtrend, price generally moves between the Basis Band and the Lower Band, with the middle line serving as dynamic resistance.
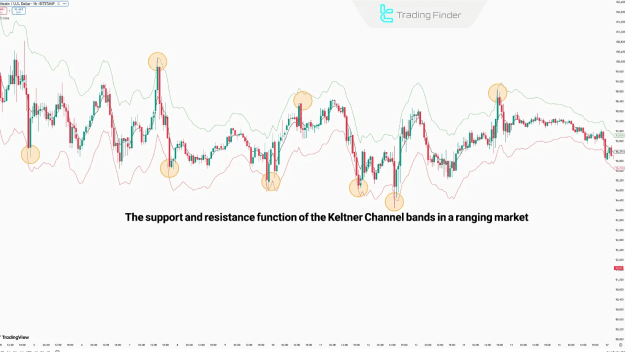
- Range-bound Market: During a range-bound market, price often oscillates around the middle line, while the upper and lower bands function as resistance and support levels, respectively.
Receiving Breakout Signals Using the Keltner Channels:
The interpretation of breakout signals with the Keltner Channel varies depending on the market's bullish or bearish structure.
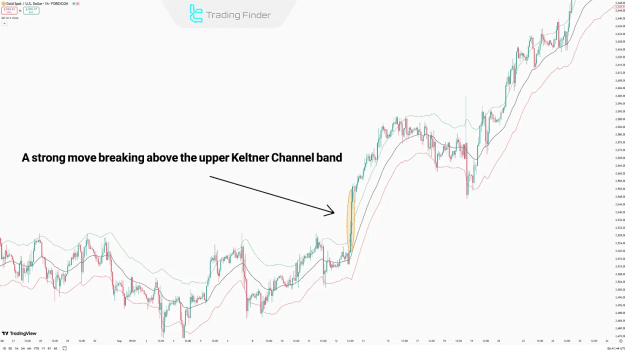
- Bullish Breakout: A bullish breakout signal is generated when the Upper Band is decisively broken by strong candles, typically accompanied by increased trading volume.
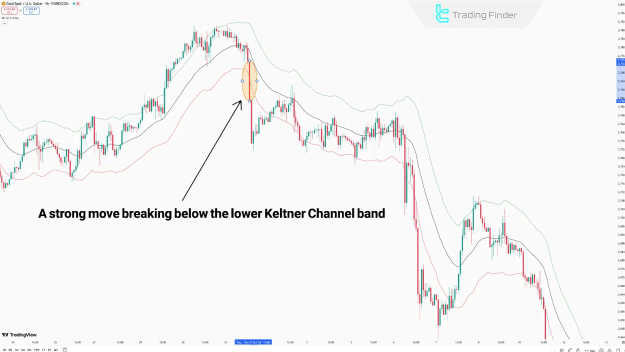
- Bearish Breakout: A bearish breakout signal occurs when the Lower Band is decisively broken by strong candles, also often associated with increased market volume.
Trading with the Keltner Channel
The Keltner Channels indicator utilizes the principles of EMA and ATR to identify strategic entry and exit points, as well as appropriate stop-loss levels.
Long Position Trading Using the Keltner Channels:
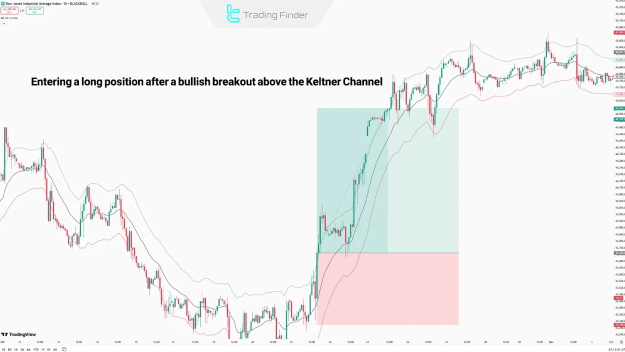
- Entry: A long position entry is typically initiated after a strong candle, coupled with increased market volume, breaks above either the Basis Band or the Upper Band.
- Stop Loss: The stop-loss order for a long position is generally placed below the Basis Band or the Lower Band.
- Exit: The first exit signal occurs with a break below the middle line. Approaching and testing the lower line can provide a subsequent exit indication.
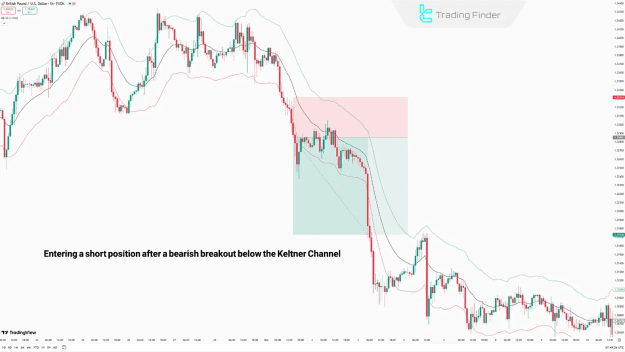
Short Position Trading Using the Keltner Channels:
- Entry: A short position entry is typically initiated after a strong candle, coupled with increased market volume, breaks below either the Basis Band or the Lower Band.
- Stop Loss: The stop-loss order for a short position is generally placed above the Basis Band or the Upper Band.
- Exit: The first exit signal occurs with a break above the middle line. Approaching and testing the upper line can provide a subsequent exit indication.
Differences Between the Keltner Channels and Bollinger Bands
While the Keltner Channels share similarities with Bollinger Bands, they differ significantly in their calculation methods, signal generation, and trading applications.
- Moving Average: Keltner Channels utilize the Exponential Moving Average (EMA), whereas Bollinger Bands employ the Simple Moving Average (SMA).
- Volatility Measure: Keltner Channels measure volatility using the Average True Range (ATR), while Bollinger Bands use Standard Deviation.
- Sensitivity to Market Volatility: Keltner Channels exhibit moderate sensitivity to market volatility, in contrast to Bollinger Bands, which are highly sensitive.
- Performance in Range-bound Markets: Keltner Channels perform weakly in range-bound markets, whereas Bollinger Bands generally perform well.
- Primary Application: The primary application of Keltner Channels is identifying trends and breakout points, while Bollinger Bands are primarily used for identifying volatility and overbought/oversold levels.
Conclusion
The Keltner Channels indicator serves as a versatile tool applicable across various short-term and long-term trading strategies.
While it excels at identifying robust trends and breakout points, it's important to note that its signals may be less accurate in range-bound and low-volatility market conditions. To mitigate false signals, traders can effectively combine the Keltner Channels with complementary indicators, such as volume indicators or oscillators.