TP & SL Tool: Risk Reward Ratio Calculator RRR MT5 | Prop Firm Protector: Trade Assist Prop Firm Plus TF Expert MT5 | Money Management + DrawDown Protector: Trade Panel Prop Firm Drawdawn Limiter Pro MT5 |Get a free Expert Advisor license via Telegram and WhatsApp
Gartley Harmonic Pattern Indicator:
Gartley Harmonic Pattern MT4 Indicator
Gartley Harmonic Pattern MT5 Indicator
Understanding the Gartley Pattern in Technical Analysis
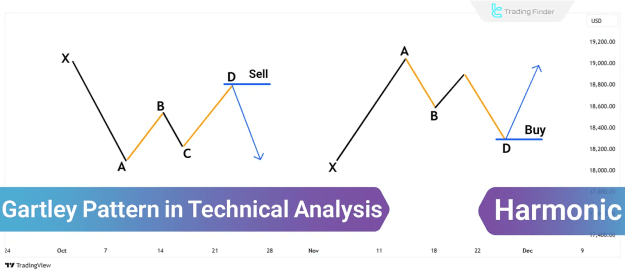
Often referred to as the "222" pattern, the Gartley pattern integrates the well-known ABCD pattern with an additional initial point, designated as X. This pattern typically emerges during a trend correction phase, visually resembling the letter 'M' in an uptrend (bullish Gartley) or 'W' in a downtrend (bearish Gartley).
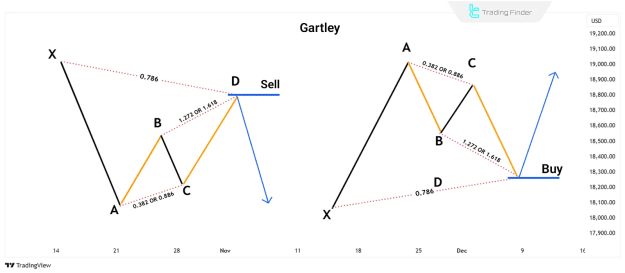
The structure of the Gartley pattern involves four distinct price movements, all meticulously calculated based on specific Fibonacci ratios:
- The AB leg must retrace 0.618 of the XA leg.
- The BC leg demonstrates a retracement of either 0.382 or 0.886 of the AB leg.
- If the BC retracement is 0.382 of AB, the CD leg should extend 1.272 times BC.
- If the BC retracement is 0.886 of AB, the CD leg will extend 1.618 times BC.
- The CD leg represents a 0.786 retracement of the XA leg.
Trading Strategies with the Gartley Pattern
Successful trading with the Gartley pattern requires its complete formation. Once the pattern is validated, traders can utilize Fibonacci ratios in conjunction with other technical analysis tools to determine precise entry points, stop-loss levels, and profit targets.
Key considerations for trading with the Gartley pattern include:
- Entry Point: Initiate a trade when the price reaches Point D and exhibits clear signs of a trend reversal.
- Stop Loss: For buy trades, the stop loss is typically placed slightly below Point X. Conversely, for sell trades, it's positioned above Point X.
- Take Profit: Initial price targets are often set at Point B, with subsequent targets at Point C, based on Fibonacci extensions.
The Gartley Pattern and Its Harmonic Variations
The popularity of the original Gartley pattern led to subsequent modifications and the development of several new harmonic patterns, each with unique Fibonacci ratios. Some prominent variations include:
Crab Pattern
Introduced by Scott M. Carney in 2000, the Crab pattern employs extended Fibonacci ratios, making it one of the most accurate harmonic patterns for identifying price reversal points. Its reversal point is typically further extended than that of the Gartley pattern, potentially enhancing the risk-to-reward ratio.
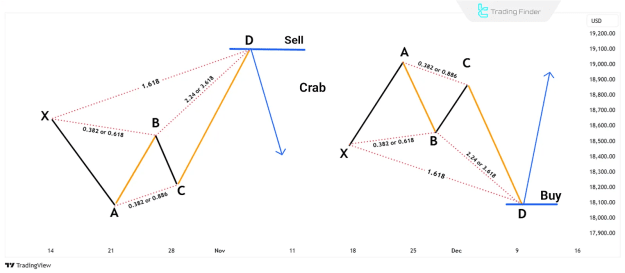
Characteristics of the Crab pattern:
- The AB leg must retrace either 0.382 or 0.618 of the XA leg.
- The BC leg can retrace 0.382 or 0.886 of the AB leg.
- If BC is 0.382 of AB, the CD leg must be 2.24 times BC.
- If BC is 0.886 of AB, the CD leg must be 3.618 times BC.
- The CD leg is a 1.618 extension of the XA leg.
Bat Pattern
The Bat pattern, another contribution from Scott Carney in 2001, shares similarities with the Gartley pattern but features different Fibonacci ratios, indicating deeper reversal points. This pattern proves particularly effective in volatile market conditions. The reversal point in the Bat pattern typically occurs at the 0.886 level of the XA move.
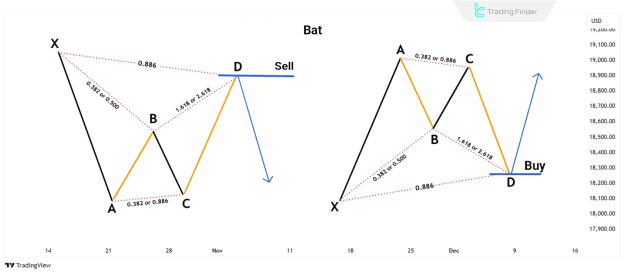
Characteristics of the Bat pattern:
- The AB leg must retrace either 0.382 or 0.500 of the XA leg.
- The BC leg can retrace 0.382 or 0.886 of the AB leg.
- If BC is 0.382 of AB, the CD leg should be 1.618 of BC.
- If BC is 0.886 of AB, the CD leg should be 2.618 of BC.
- The CD leg is a 0.886 retracement of the XA leg.
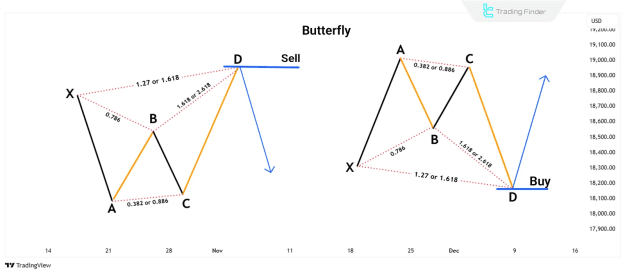
Butterfly Pattern
Introduced by Bryce T. Gilmore, the Butterfly pattern identifies price reversal points when the market reaches an extended level. It features deeper reversal points compared to the Gartley pattern and utilizes specific Fibonacci ratios to define its entry and exit points.
Characteristics of the Butterfly pattern:
- The AB leg is a 0.786 retracement of the XA leg.
- The BC leg can retrace 0.382 or 0.886 of the AB leg.
- If BC is 0.382 of AB, the CD leg should be 1.618 of BC.
- If BC is 0.886 of AB, the CD leg should be 2.618 of BC.
- The CD leg is a 1.272 or 1.618 extension of the XA leg.
Advantages and Disadvantages of Harmonic Patterns Derived from the Gartley Pattern
Here's a summary of the pros and cons associated with these prominent harmonic patterns:
Gartley Pattern
- Advantages: Highly reliable and frequently observed in the market, offers accurate identification of reversal points, and provides a suitable risk-to-reward ratio.
- Disadvantages: Requires significant experience for precise identification and drawing, and its effectiveness may be diminished in highly volatile market conditions.
Crab Pattern
- Advantages: Exceptional accuracy in identifying reversal points and presents substantial potential profit opportunities.
- Disadvantages: Often necessitates a wider stop loss, and the inherent rapid price movements can lead to higher risk.
Bat Pattern
- Advantages: Exhibits a high success rate, allows for smaller stop-loss placements, and is well-suited for trading in volatile markets.
- Disadvantages: More intricate to identify accurately and often requires additional confirmation signals before trade entry.
Butterfly Pattern
- Advantages: Offers high profit potential and is particularly effective for identifying robust reversal points.
- Disadvantages: Complex to identify and execute correctly, and its risk-to-reward ratio can be variable.
Conclusion
The Gartley pattern stands as one of the most effective tools in technical analysis for discerning trend reversal points in markets such as Forex and cryptocurrency. Successful execution of the Gartley pattern, along with its variations, hinges on a thorough understanding of Fibonacci ratios and the precise identification of entry and exit points.