TP & SL Tool: Risk Reward Ratio Calculator RRR MT5 | Prop Firm Protector: Trade Assist Prop Firm Plus TF Expert MT5 | Money Management + DrawDown Protector: Trade Panel Prop Firm Drawdawn Limiter Pro MT5 |Get a free Expert Advisor license via Telegram and WhatsApp
Application of Classic Patterns in Financial Markets
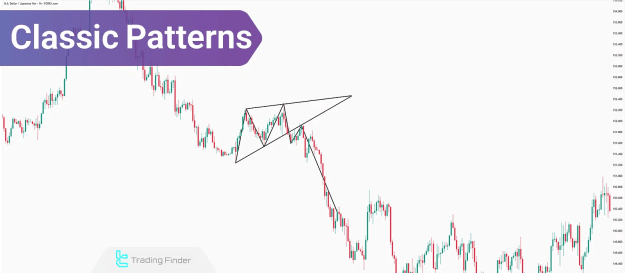
Given their repetitive nature, classic chart patterns are invaluable for forecasting price action. Their ability to clearly define highs and lows makes them highly effective in pinpointing optimal entry points and establishing precise stop-loss levels. This clarity is crucial for managing risk and maximizing potential returns.
Reasons for Using Classic Patterns
Despite being traditional methods, classic chart patterns remain widely utilized in financial markets due to several key advantages:
- Simplicity in identification: Their distinct visual characteristics make them relatively easy to spot on price charts.
- Compatibility with other analytical tools: They seamlessly integrate with indicators, trading volume analysis, and candlestick patterns, enhancing the overall reliability of trading signals.
Reliable Chart Patterns: Reversal and Continuation
Classic chart patterns are broadly categorized into two types based on their implications for trend direction:
Reversal Patterns
Reversal patterns signal a weakening of the current trend and indicate a high probability of a trend reversal.
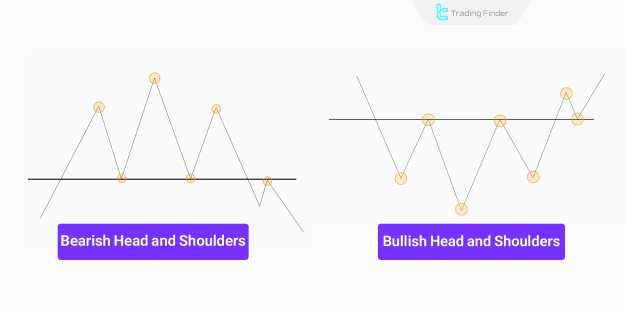
- Head and Shoulders: This prominent reversal pattern comprises a larger middle peak (or valley) flanked by two smaller side peaks (or valleys). It signals the potential end of a trend and a shift in price direction. This pattern is most reliable in medium to long-term timeframes (H1, H4, and Daily charts), requiring a strong preceding trend for optimal confirmation.
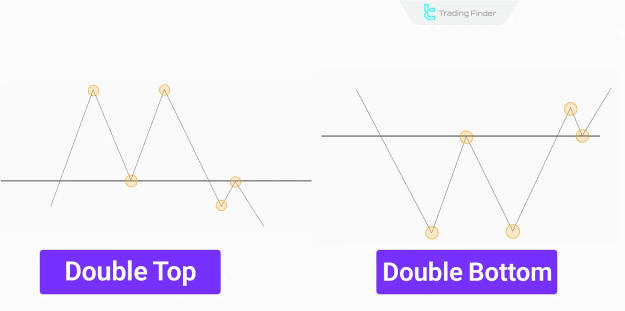
- Double Top & Double Bottom:
- A Double Top forms two consecutive peaks at a resistance level, suggesting a bearish reversal.
- Conversely, a Double Bottom forms two troughs at a support level, indicating a potential bullish reversal. These patterns are frequently observed in short to medium-term timeframes (M30, H1, H4 charts), typically emerging after significant price movements.
- Triple Top & Triple Bottom:
- A Triple Top occurs when the price attempts to break through resistance three times unsuccessfully, signaling a potential downtrend.
- A Triple Bottom forms when the price bounces off support three times, strengthening the likelihood of an uptrend. These patterns are more prominent in medium to long-term timeframes (H4, Daily, Weekly charts) due to the multiple attempts required for price to breach critical levels.
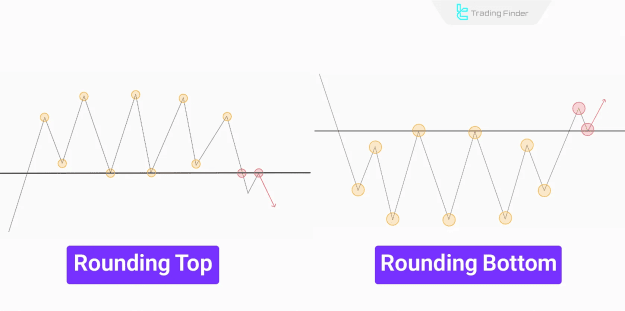
- Rounding Bottom & Rounding Top:
- A Rounding Bottom depicts a gradual downward movement that smoothly transitions upward, forming a semi-circular shape at the bottom, indicative of an uptrend.
- A Rounding Top forms a smooth arc at the peak of a price movement, signaling a downtrend. Given their slow formation, these patterns typically appear in long-term timeframes (Daily and Weekly charts).
Continuation Patterns
Continuation patterns suggest that the prevailing trend will resume after a brief period of consolidation or correction.
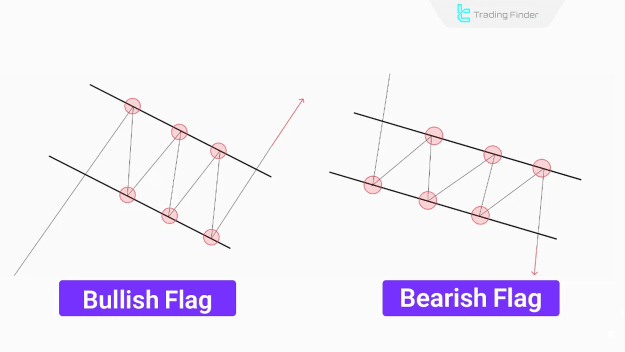
- Flag: This is a short-term continuation pattern that typically follows a substantial price movement (the flagpole). It consists of a small, contained channel moving counter to the primary trend, usually breaking out in the direction of the original trend. The Flag pattern is particularly useful for scalping and day trading in short to medium-term timeframes (M5, M15, M30, H1).
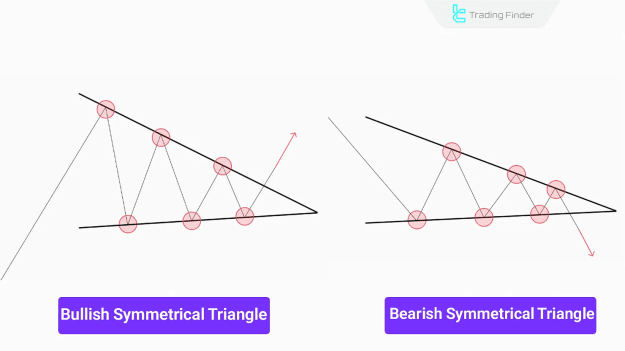
- Symmetrical Triangle: This continuation pattern shows price fluctuating within a narrowing range, defined by two converging trendlines. It usually precedes a significant breakout.
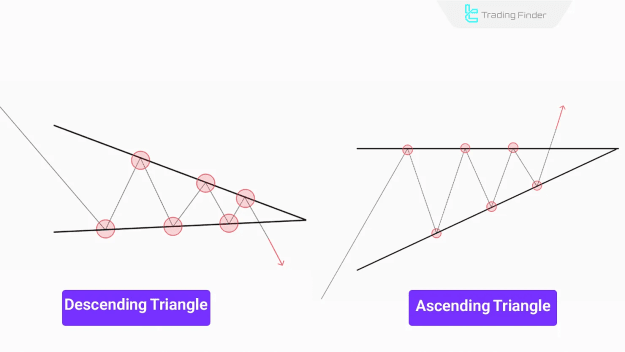
- Ascending & Descending Triangle:
- An Ascending Triangle features a horizontal resistance line and rising lows, often leading to an upward breakout.
- A Descending Triangle presents horizontal support and declining highs, signaling a potential downward breakout.
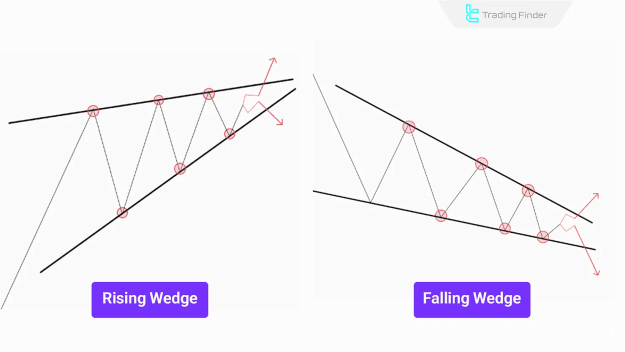
- Wedges: Wedges include Rising Wedges and Falling Wedges, often forming within high-momentum trends.
- A Rising Wedge slopes upward and typically results in a bearish breakout.
- A Falling Wedge slopes downward and generally breaks out bullish.
- Rectangle: The Rectangle pattern signifies sideways price movement, where price oscillates between defined support and resistance levels before breaking out.
Advantages and Disadvantages of Classic Patterns
Like all trading strategies, classic chart patterns have their own strengths and weaknesses:
Advantages
- Simple visual identification: Their distinctive shapes make them easy to spot.
- Usable in all financial markets: Applicable across Forex, stocks, cryptocurrencies, and commodities.
- Compatible with other analysis tools: Can be combined with various indicators for enhanced accuracy.
Disadvantages
- Possibility of fake breakouts: Not all pattern formations lead to confirmed trend continuations or reversals.
- Requires confirmation with indicators and volume: Relying solely on patterns can lead to false signals.
- Delayed signal confirmation: Often, confirmation comes after a significant portion of the move has already occurred.
Enhancing Trend Identification with Classic Patterns
To effectively identify strong trends, merely recognizing classic chart patterns is insufficient. It is crucial to analyze how they form within the broader context of market liquidity flow.
Combining the analysis of highs and lows structure with candlestick behavior and trading volume provides essential confirmatory signals for trade entry and exit:
- Pattern Shape: Analyze how price forms highs and lows within the pattern.
- Candlestick Charts: Identify underlying buyer/seller pressure through candlestick formations.
- Volume Analysis: Increasing volume on a breakout strongly confirms the pattern's validity.
- Confirmation with Technical Indicators: Utilize indicators such as RSI, MACD, and Moving Averages for further validation.
- Multiple Timeframe Analysis: Verify pattern reliability across different timeframes to reduce false signals.
Combining Classic Patterns with Common Indicators
While classic chart patterns are prevalent across all financial markets, their inherent weaknesses can be mitigated by combining them with other trading strategies.
Using the RSI Indicator to Confirm Signals
The Relative Strength Index (RSI) can be used in conjunction with classic patterns to identify overbought and oversold zones. For instance, if RSI is in the oversold zone and a Double Bottom pattern forms, the likelihood of a bullish trend reversal significantly increases.
Combining Classic Patterns with the MACD Indicator
The Moving Average Convergence Divergence (MACD) indicator helps confirm the breakout of classic chart patterns by analyzing divergence and convergence. If a Head and Shoulders bearish breakout aligns with a MACD bearish crossover, the probability of continued price decline is strengthened.
Conclusion
Classic chart patterns are invaluable tools for technical analysis, categorized into Reversal Patterns (e.g., Head and Shoulders, Double Top/Bottom, Triple Top/Bottom, Rounding Bottom/Top) and Continuation Patterns (e.g., Flags, Symmetrical Triangles, Ascending/Descending Triangles, Wedges, Rectangles).
To enhance their accuracy and reduce the occurrence of false signals, it is highly recommended to combine the analysis of these patterns with candlestick analysis, volume indicators, and momentum tools like RSI and MACD. This multi-faceted approach provides more robust trading signals and improves overall trading effectiveness.