TP & SL Tool: Risk Reward Ratio Calculator RRR MT5 | Prop Firm Protector: Trade Assist Prop Firm Plus TF Expert MT5 | Money Management + DrawDown Protector: Trade Panel Prop Firm Drawdawn Limiter Pro MT5 |Get a free Expert Advisor license via Telegram and WhatsApp
Understanding Imbalance and Inefficiency: SIBI and BISI
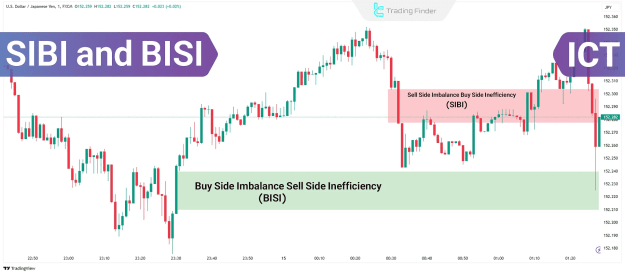
The Buy-Side and Sell-Side Imbalance and Inefficiency concepts within the ICT framework provide insights into market dynamics.
What are Buy-Side Imbalance and Sell-Side Inefficiency (BISI)?
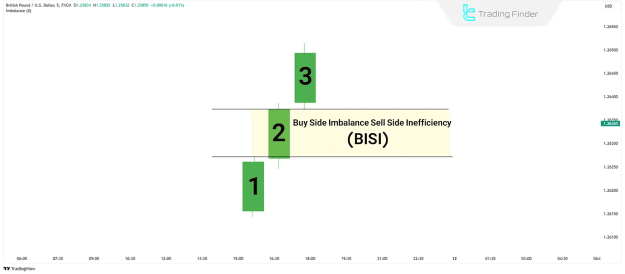
Buy-Side Imbalance and Sell-Side Inefficiency (BISI) denotes a bullish gap that signals strong buying pressure in the market.
Formation of Buy-Side Imbalance and Inefficiency (BISI) in ICT Style
The BISI pattern is structured from three distinct candlesticks:
- The first candle exhibits a large bullish body, marking the initiation of substantial buying pressure.
- The second candle maintains the upward trajectory with a significant body.
- The third candle extends the upward movement, creating a gap.
This gap forms between the highest price of the first candle and the lowest price of the third candle. This formation highlights aggressive buying activity and a progressive reduction in selling pressure.
How to Trade Using BISI
Trading with BISI begins with accurately identifying the pattern. The initial candle must be large and bullish, followed by a second candle that sustains the upward momentum, and finally, a third candle that generates the gap. Upon confirming this gap, traders can validate the buying pressure and initiate a long position.
Functionality of the Buy-Side Imbalance and Inefficiency (BISI) Concept in ICT Style
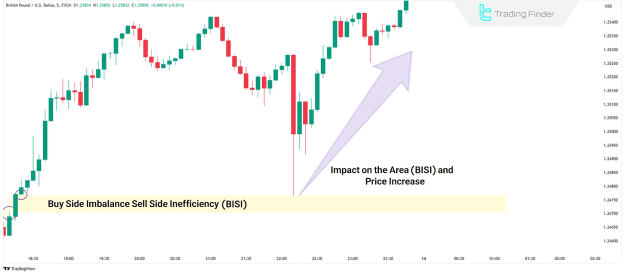
BISI primarily acts as a support level, signifying areas where buying interest is strong enough to potentially halt or reverse downward price action.
What is Sell-Side Imbalance and Buy-Side Inefficiency (SIBI)?
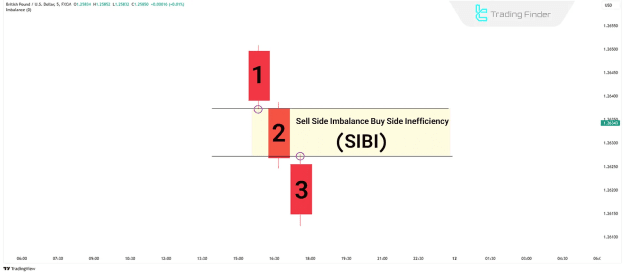
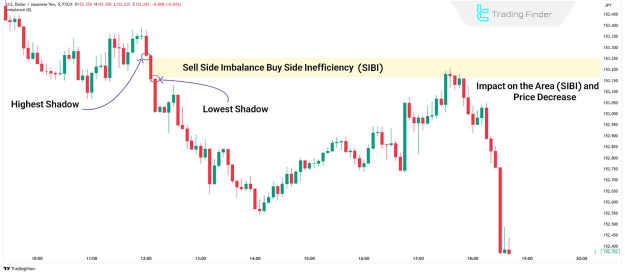
Sell-Side Imbalance and Buy-Side Inefficiency (SIBI) represents a bearish gap that indicates powerful selling pressure.
Sell-Side Imbalance and Buy-Side Inefficiency (SIBI) Formed by Three Candles in a Bearish Trend
The SIBI pattern also consists of three candlesticks:
- The first candle displays a large bearish body, signaling the commencement of intense selling pressure.
- The second candle continues the downward movement with a large body.
- The third candle prolongs the downward trend, establishing a gap.
This gap is created between the lowest price of the first candle and the highest price of the third candle. This structure underscores aggressive selling activity and a gradual decrease in buying pressure.
How to Trade Using SIBI
To trade using SIBI, the pattern must first be precisely identified. The first candle should exhibit a large bearish body, the second candle should corroborate the bearish trend, and the third candle must produce a gap, reflecting the ongoing downward movement. Once this gap is confirmed, traders can initiate a short position, typically placing their stop-loss above the high of the third candle for effective risk management.
Functionality of the Sell-Side Imbalance and Inefficiency (SIBI) Concept in ICT Style
SIBI typically functions as a resistance level, indicating zones where selling interest is robust enough to potentially impede or reverse upward price action.
Key Considerations for Using SIBI & BISI
To maximize the effectiveness of SIBI and BISI in your trading strategy, consider these important points:
- Integration with Other Tools: Combine SIBI and BISI with other technical analysis tools, such as Order Blocks, to enhance trade accuracy and conviction.
- Risk Management: Always implement appropriate stop-loss and take-profit levels to manage risk effectively and protect capital.
- Confirmation is Key: Always wait for additional confirmation, such as market structure shifts or strong price action signals, before entering a trade based on SIBI or BISI.
What is the Difference Between SIBI/BISI and Fair Value Gaps (FVG)?
While SIBI and BISI are types of Fair Value Gaps, there are distinct differences in their structure and the market conditions they signify:
- Trend Strength: SIBI and BISI predominantly appear in strong, trending markets, whereas FVGs can represent temporary imbalances resulting from supply and demand disparities across various market conditions.
- Candle Alignment: In SIBI and BISI, both the first and third candles consistently align with the prevailing trend, reinforcing the directional bias. In general FVGs, this consistent alignment of the outer candles is not always present.
Conclusion
The SIBI and BISI concepts within the ICT trading style are invaluable for traders aiming to identify price imbalance zones. These zones serve as critical areas for potential trade entries and exits. While sharing similarities with general Fair Value Gaps, SIBI and BISI are specifically characterized by their occurrence in robust trends, with two same-direction candlesticks framing the imbalance, providing higher conviction signals.