Top 10 Support and Resistance Indicators for Enhanced Trading
Here's a comprehensive list of the best support and resistance indicators commonly utilized in technical analysis:
- Auto Fibonacci Retracement Indicator
- Trendlines Indicator
- Ichimoku Cloud Indicator
- Support Resistance Major/Minor Indicator
- Linear Regression Channel Indicator
- Zone Indicator
- Pivot Point All-in-One Indicator
- Key Price Action Level Indicator
- Moving Average Indicator
- Donchian Channel Indicator
In-Depth Look at Key Support and Resistance Indicators
1. Auto Fibonacci Retracement Indicator
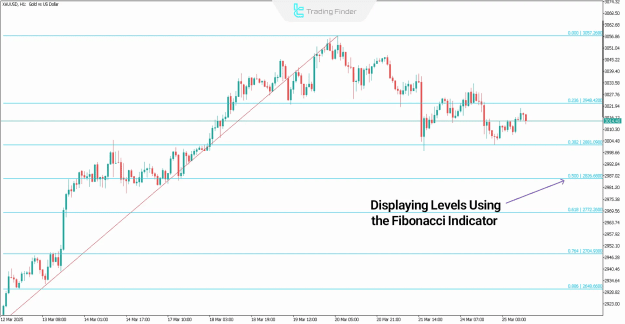
Fibonacci levels are often considered "hidden" support and resistance zones within established trend structures. By identifying crucial retracement points, they offer precise entry and exit opportunities. The Auto Fibonacci Indicator streamlines this process by automatically detecting and plotting these levels.
Availability:
- Auto Fibonacci Retracement Indicator for MetaTrader 4
- Auto Fibonacci Retracement Indicator for MetaTrader 5
- Auto Fibonacci Retracement Indicator for TradingView
Example: Fibonacci levels plotted by the Auto Fibonacci Indicator on a XAU/USD 1H chart.
2. Trendlines Indicator
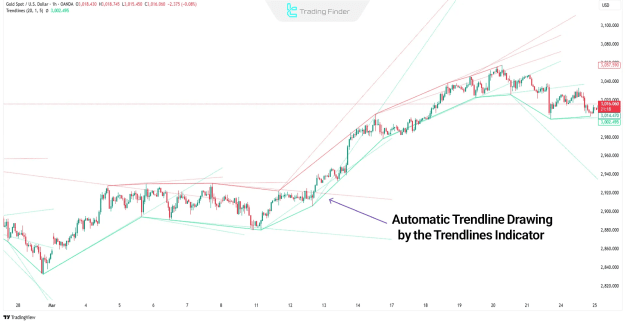
Trendlines are essential in technical analysis as they represent dynamic support and resistance levels and are crucial for determining trend direction. The Trendlines Indicator on TradingView provides automatic trendline plotting, simplifying market structure analysis.
Example: Trendlines drawn by the Trendlines Indicator on TradingView.
3. Support Resistance Major/Minor Indicator
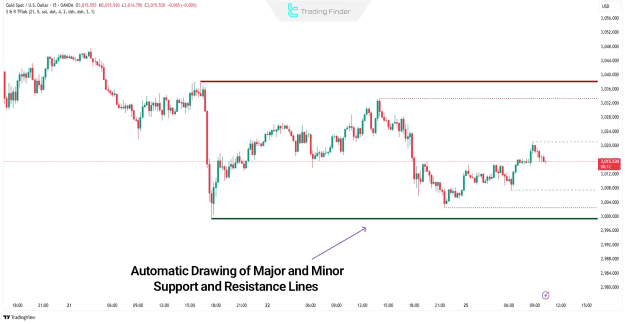
Major and Minor support and resistance levels typically form around significant price highs and lows where order flow is highly concentrated. The Support Resistance Major/Minor Indicator for TradingView clearly highlights these zones for rapid and efficient analysis.
Example: Major and minor support/resistance levels on XAU/USD using the Support Resistance Indicator in TradingView.
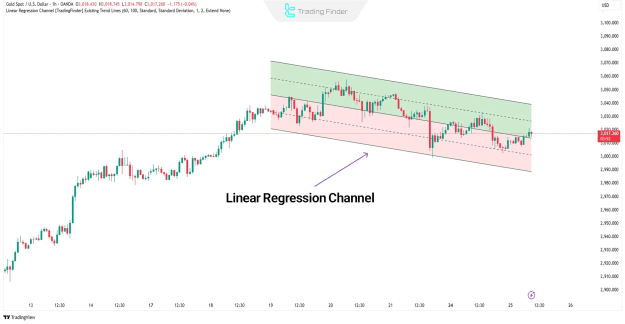
4. Linear Regression Channel Indicator
Price channels delineate dynamic support and resistance zones within prevailing market trends. The Linear Regression Channel Indicator automatically plots parallel lines to define the current price channel, assisting in volatility analysis.
Availability:
- Linear Regression Channel Indicator on TradingView
- Linear Regression Channel Indicator for MetaTrader 4
- Linear Regression Channel Indicator for MetaTrader 5
Example: An automatically plotted linear regression channel on TradingView.
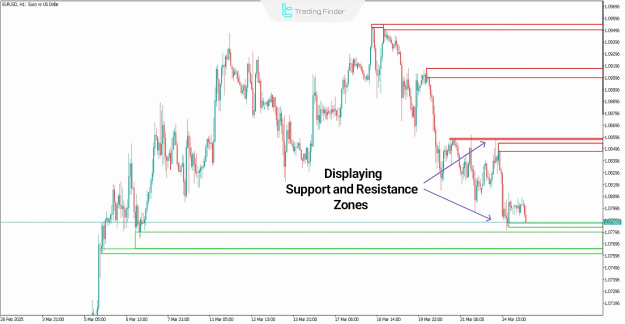
5. Zone Indicator
The Zone Indicator identifies specific support and resistance zones based on historical price behavior. It distinctly highlights key areas, typically using green for support and red for resistance, thereby offering enhanced clarity of sensitive market levels.
Availability:
- Zone Indicator for MetaTrader 4
- Zone Indicator for MetaTrader 5
- Zone Indicator for TradingView
Example: Support (green) and resistance (red) zones drawn by the Zone Indicator on MetaTrader 5.
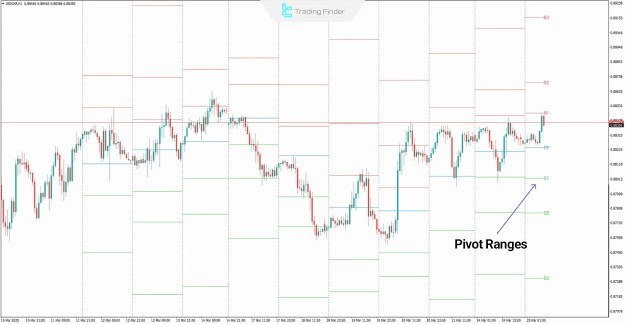
6. Pivot Point All-in-One Indicator
Pivot Points are vital support and resistance zones derived from previous price data, extensively used to determine entry, exit, and reversal levels. The Forex Pivot Points Calculator Tool by TradingFinder is freely available.
Availability:
- Pivot Point All-in-One Indicator for MetaTrader 4
- Pivot Point All-in-One Indicator for MetaTrader 5
- Pivot Point All-in-One Indicator for TradingView
Example: A comprehensive view of pivot lines using the Pivot Point All-in-One Indicator.
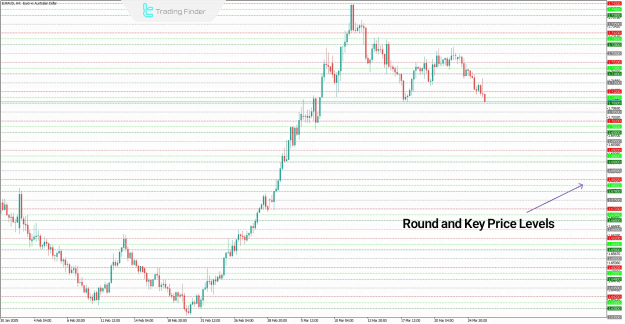
7. Key Price Action Level Indicator
This indicator effectively detects round-number levels and price action zones, helping traders identify areas of significant historical price activity. It functions as a powerful supply and demand indicator.
Availability:
- Key Price Action Level Indicator for MetaTrader 4
- Key Price Action Level Indicator for MetaTrader 5
- Key Price Action Level Indicator for TradingView
Example: Key price action levels automatically drawn by the Key PA Level Indicator on MetaTrader.
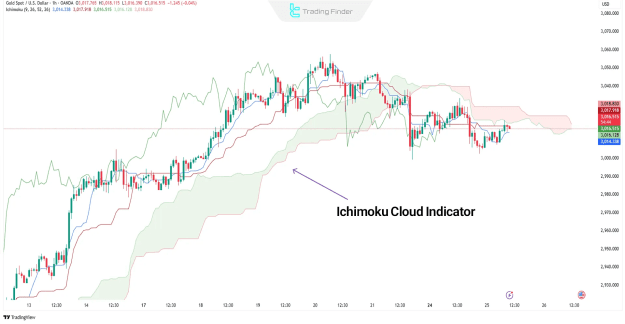
8. Ichimoku Cloud Indicator
The Ichimoku Cloud is an advanced technical analysis tool that integrates multiple components to signal market trends, support/resistance levels, and price positioning. Each component can provide standalone signals or collectively form a comprehensive trading system.
Example: Major support and resistance levels identified by Ichimoku Cloud components.
9. Moving Average Indicator
The Moving Average is one of the most widely used dynamic support/resistance tools in trading. Available in both Simple (SMA) and Exponential (EMA) versions, it can be customized for any timeframe and market condition.
Example: Dynamic support/resistance levels shown by the Simple Moving Average on XAU/USD.
10. Donchian Channel Indicator
The Donchian Channel identifies dynamic support and resistance zones by tracking the highest highs and lowest lows over a defined period. It is particularly effective for breakout and trend-following strategies, offering increased accuracy on higher timeframes.
Example: Support and resistance zones, represented by upper and lower bounds, drawn by the Donchian Channel.
How to Select the Optimal Support and Resistance Indicator
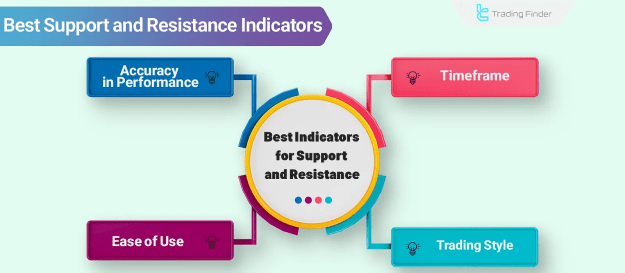
In technical analysis, the accurate identification of support and resistance levels is only effective when the chosen indicator aligns seamlessly with your timeframe, trading strategy, and individual trading style. The effectiveness of Support and Resistance Indicators in highlighting sensitive price zones largely depends on their signal precision, ease of interpretation, and compatibility with specific market structures.
1. Timeframe Considerations
The chosen trading timeframe directly influences an indicator's performance.
- Some indicators are better suited for short-term timeframes (e.g., 5-minute charts), while others are designed for long-term timeframes (e.g., daily charts).
- Notably, support and resistance zones identified on higher timeframes tend to be more powerful and reliable.
2. Trading Style Alignment
Selecting Indicators for Support and Resistance that align with a trader's execution speed and analytical approach significantly impacts signal accuracy. This choice must correspond with both the trading style and the chosen timeframe:
- Scalpers typically require fast indicators suitable for 1 to 15-minute charts.
- Swing Traders often utilize indicators tailored for 1 to 4-hour charts.
- Trend Traders prefer indicators optimized for larger timeframes, such as daily and weekly charts.
3. Ease of Use
Some indicators feature a straightforward design and are relatively simple to operate. In contrast, more complex indicators necessitate deeper training and extensive analysis for effective utilization.
4. Accuracy and Performance
While indicators are designed to generate accurate signals, some may produce more false signals than others. To effectively assess their reliability, backtesting on historical data is crucial. Furthermore, combining indicators with other analytical tools can significantly enhance the accuracy and robustness of trading strategies.
Conclusion
The selection of the Best Support and Resistance Indicators is a personalized process dependent on your unique trading approach and prevailing market conditions. Tools such as Pivot Points, Fibonacci Retracements, and Moving Averages consistently prove highly effective in identifying crucial price zones.