M5-Two-Way-Confirmation-Strategy
Live Trading
When I say "M5-Two-Way Confirmation Strategy" so I will point out that I use this plenty strategy mainly at M5 but it could also applied at any time frames. So you can work with it at multiple time frames.
Currency Pair: all (preferred: EURUSD > tight spread, higher volatility)
Time Frame: 5 Min (All > see Multiple Time Frame Section, please and #72, #76 #77, #78)
Indicators: BB14, ADX14, SSD 5,3,3*, EMA 5,13,21,55,200, Pivotal Points,
Optional: CCI, RSI, MACD
(*SSD = Full Stochastics, see #8, please).
This technique is used in combination with Bollinger Bands 14,2, ADX 14 , SSD 5, 3, 3, EMA 9, 13, 21, 55, 200 and the Pivotal Points.
Buy/Sell Signals:
Entry Options:
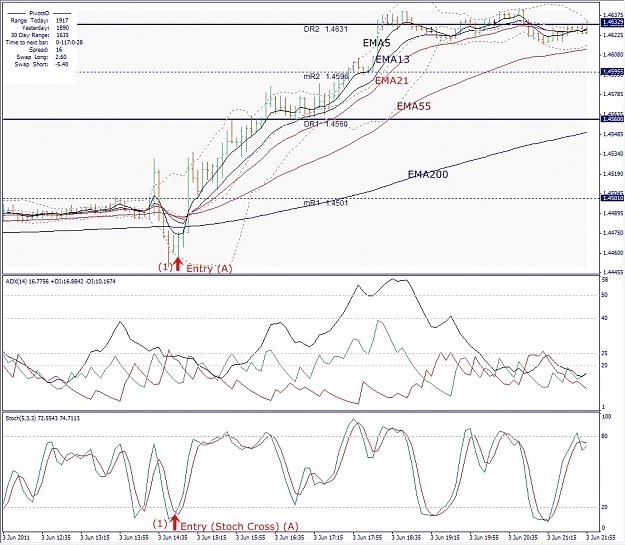
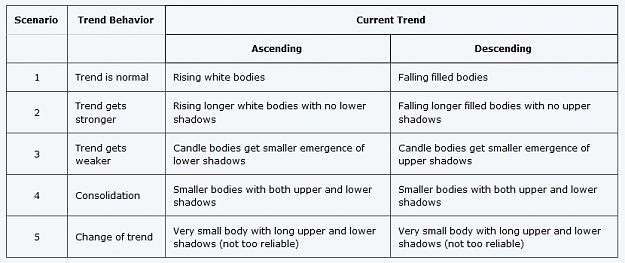
(1) After two hollow or two filled candles;
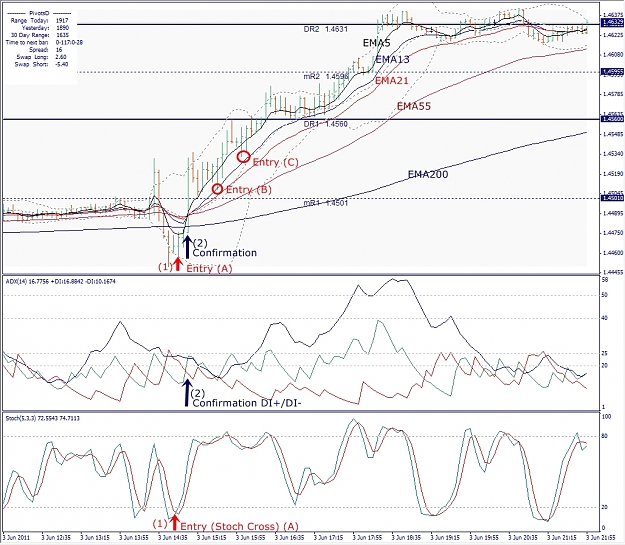
(2) If a candle closes at the other side of EMA13;
(3) At EMA9/EMA13 crossover.
(4) Entry ahead of Time. See "Trade Examples", please. (Here you have higher risk but you make also more profit)
Leading indicator: SSD 5, 3, 3, crosses often 1-2 bar before.
Confirmation:
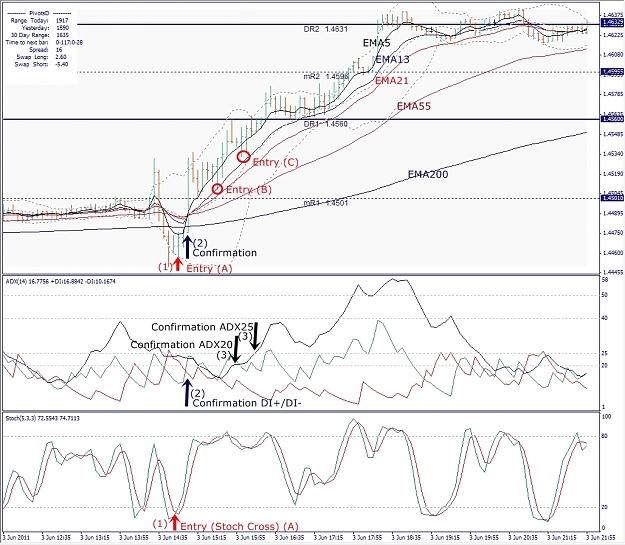
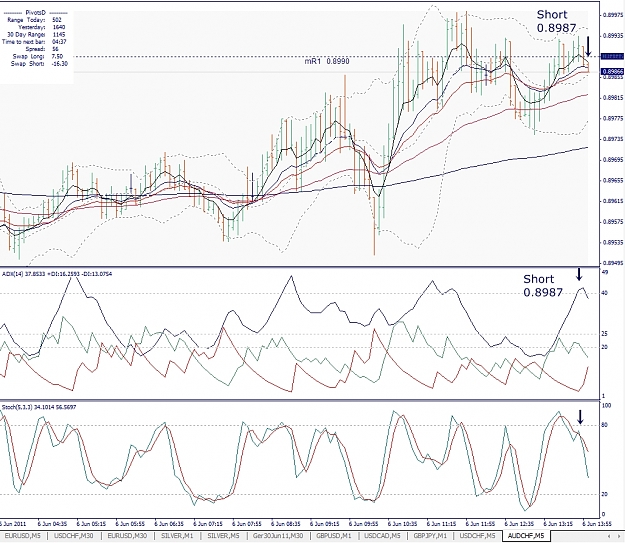
(1) +DI/-DI-line-crossover. +DI (green) and -DI (red) line (ADX 14) crosses sometimes 1-4 bars afterward entry point and the ADX value crosses the 20 line and the 25 value;
(2) The EMA9/EMA13 crossover.
Price Momentum:
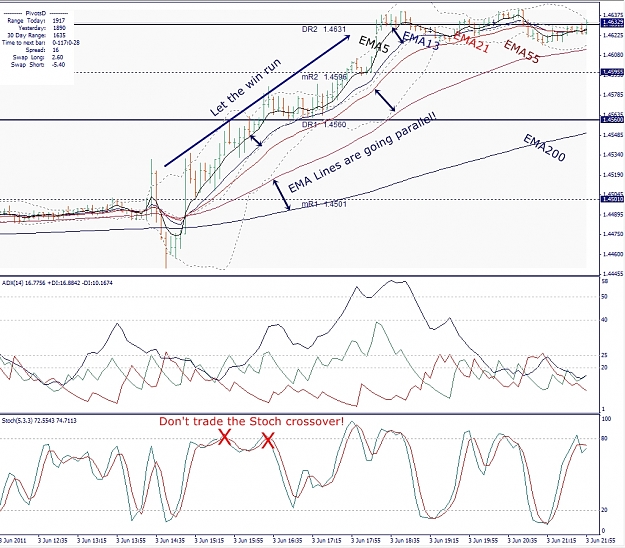
+DI stays on top of -DI — uptrend is in place.
-DI stays on top of +DI — downtrend is in place.
Strategical ideas:
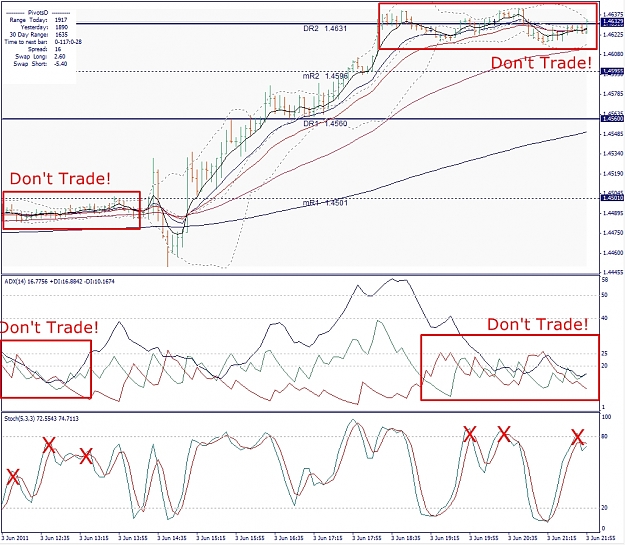
ADX -/+ DI lines are used for spotting entry signals.
All -/+ DI crossovers are disregarded while ADX remains below 20.
Once ADX peaks above 20 a buy signal occur when +DI (green) crosses upwards and above -DI (red).
A sell signal will be the opposite: -DI would cross +DI downwards.
Exit Points:
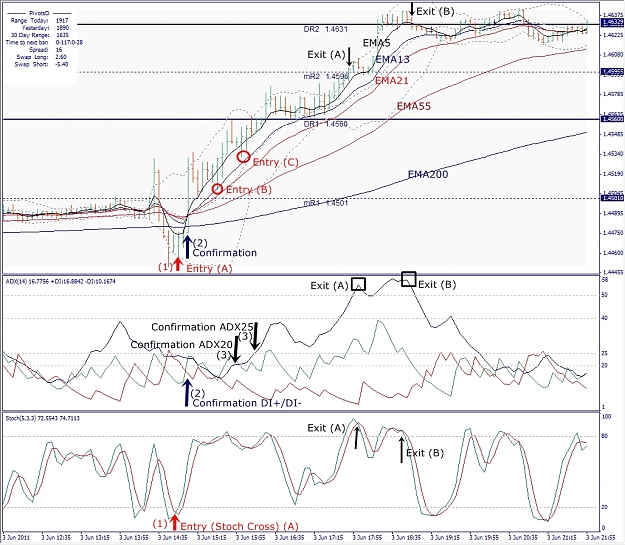
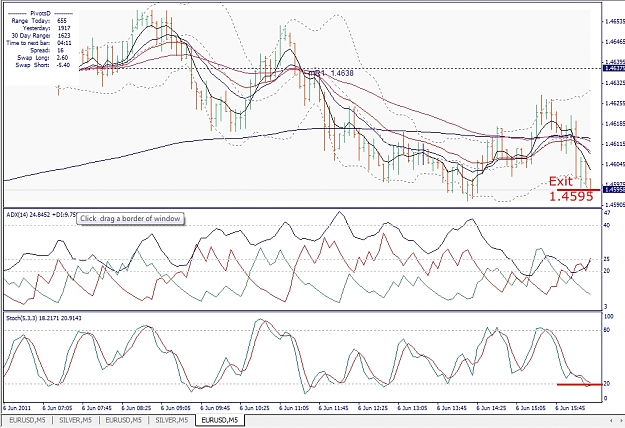
(1) At the second bar when the candles has change its color, or
(2) when the bar closes over the counterpart side of EMA5 or EMA13 line, or
(3) at the EMA5/EMA13 crossover;
(4) In all situation of +DI/-DI-line-crossovers (when trend is changing - two DI cross).
(5) Near the Pivotal Point.
- Buy and exit situations are often signalize with SSD 5, 3, 3, crossing near 20 or 80 % line;
Note:
- ADX indicator is never traded alone, but rather in combination with other indicators and tools. ADX indicator most of the time gives much later signals comparing to faster reacting moving averages crossover or Stochastic, for example, however, reliability of ADX indicator is much higher than for other indicators in traders' toolkit, which makes it a valuable tool for many Forex traders.
- If ADX is traded above 20 but below 40, it is time to apply trend following methods. An example would be: Forex trading Moving averages or trading with Parabolic SAR indicator.
- When ADX reaches 40 level (5-min-chart – e.g. ADX 50-level on 1-min-time-frame), it suggests an overbought/oversold (depending on the trend) situation on the market and it is time to protect some profits of at least move Stop loss order to a break even. See here more at SSD 5,3,3.
- When ADX passes 40 level, it is a good time to begin collecting profits gradually scaling out of the trades on rallies and sell-offs and protecting remaining positions with trailing stops. Looking at SSD 5,3,3.
Keep an eye on the clock:
Pay attention to London open (6 to 8 A.M. London time), the New York open (6 to 8 A.M. New York time) and the London close (5 to 6 P.M. London time). The markets move when these traders open and close their trades for the day.
Multiple Time Frame:
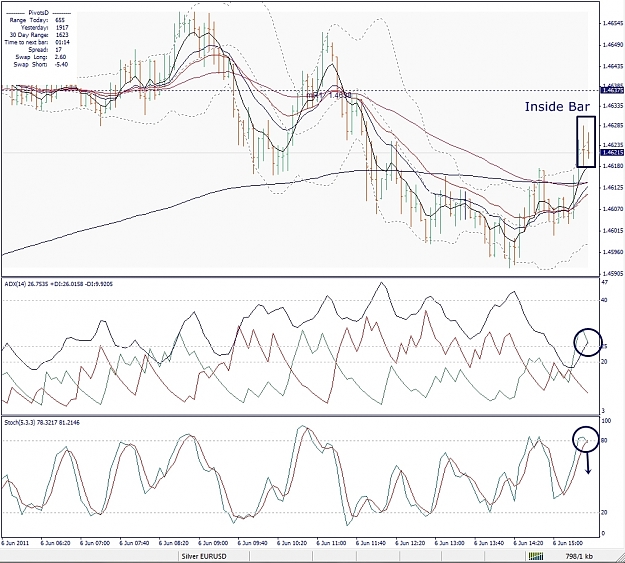
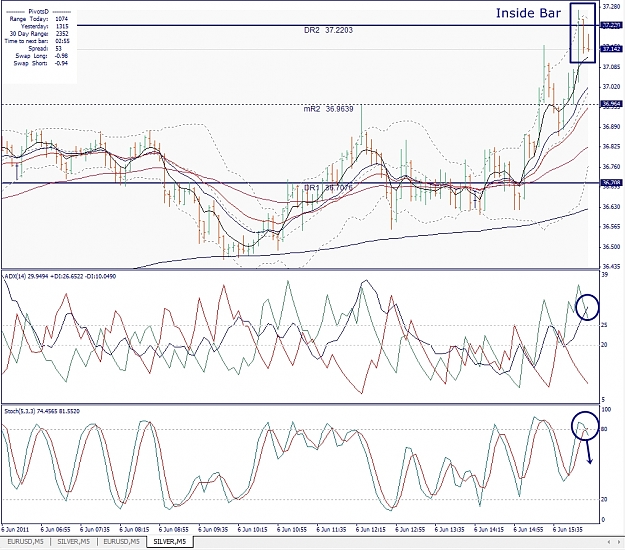
M5-Two-Way-Confirmation-Strategy is a manual trading strategy. Trades could be triggered within different time frames also(e.g. M15, M30, H1, H4, Daily and then at all currency pairs) and can used in ranging and in trending markets. M5-Two-Way-Confirmation-Strategy has used since 2006. You can use M5-2-WCS in combination with the price action (e.g. engulfing patterns, hammers, shooting stars, in bars). It's simple and efficient! If you will get other arguments more, so look at the extreme points at the pivotal points. The EMA lines will show you apart from price action momentum and if there is either a trending environment or a ranging market. (See also "Trade Examples" - "MTF").
Templates & Indicators:
See attachment, please.
Live Trading
Orders are often published in live.
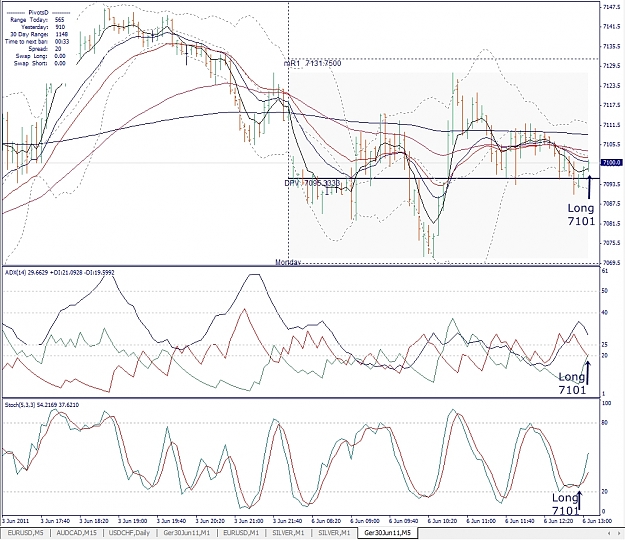
Trade ExampleS
EURUSD, M5, 2011 June 05, p.1, #2 -#7 ; Entry ahead of Time: EURUSD, H5, 2011 June 06, p.2, #17; Entry ahead of Time: Silver, M5, 2011 June 06, p.2, #18; USDJPY, M5, 2011 June 06, p.3, #43, p.4, #47; LCrudeJul11, M5, 2011 June 07, p.3, #44, #45, p.4, #46; "MTF"-GBPCHF, Daily, 2011 June 09, p.6, #85/GBPCHF, M30, 2011 June 11, p.7, #94; "MTF"-Silver, M5/M30, 2011 June 10, p.7, #92; Range Bound Trading - Picking up the Tops and Bottoms at the Bollinger Band, EURJPY, H4, 2011 June 11, p.7, #95; CCI-Divergence, CADJPY, H4, 2011 June 29, p.18, #256;
FX Knowledge & Strategies:
http://www.babypips.com/school/
http://forex-strategies-revealed.com/basic
http://www.investopedia.com/dictionary/default.asp
Articles & Links:
Forex Day Trading Using Price Action And Pivot Points, p.2, #24; Price Action Trading - Waiting For Confirmation, p.2, #25; How to Find Profitable Forex Systems, p.2, #26; 5 Minute Intraday Trading Strategy, p.2, #28; Volatility Stop Loss, p.3, #37; Average True Range, p.3, #38; Average Directional Index (ADX). How to interpret ADX. How to trade with ADX., p.3, #40; Forex Trading Strategy #2 (Parabolic SAR + ADX), p.3, #41; Forex ADX Indicator Explained, p.3, #42; Trading Using Multiple Time Frames, p.6, #77; How to Use Multi Time Frame Analysis When Trading Forex, Futures and Stocks, p.6, #78; Trading the Inside Bar Strategy in Forex, p.6, #87; Inside Bar Trading Strategy, p.6, #89; Know Your Trading Environment, p.7, #96; Bollinger Bands, p.7, #97; Bollinger Band Width And Trading Ranges, p.7, #98; How To Use Bollinger Bands (BB) In Forex, p.7, #99; Basic Bollinger System, p.7, #100; Forex Trading Hours, p.12, #166; How To Become A Successful Part-Time Forex Trader, p.12, #167; FX Exit Strategies: Keeping Your Profits, p.12, #168; Forex Price Action - Reading the Language of the Market, p.12, #174 -#181;
Demo Account:
Deposit: 25'000.-$, Beginning Date: 2011 June 14, Target: 250.-$ per Day (1% per Day).
Limited Period: 4 Days a Week (1'000.-$) / 4 Weeks a Month (4'000.-$) / 10 Months a Year (40'000.-$).
Actual:
2011 June 23 Equity: 36.516.-$, Profit: + 11.516.-$ , see p.15, #218, please.
http://twitter.com/#!/forexcube
http://www.forexfactory.com/forexcube
http://www.myfxbook.com/members/Forexcube
Closed Accounts:
When 100% Profit is made Accounts will be closed.
Deposit: 10'000.-$, Beginning Date: 2011 June 21, "Turbo-High-Risk-Scalping-Account", 2011 June 23 Equity: 20'846.48$, Profit: + 10.846.48, (100% within 3 Days), see p.14, #210, please.
Indicator trustfulness? Whatever seems to work for you is fine!
I wish you success & happiness!
FXcube
Live Trading
When I say "M5-Two-Way Confirmation Strategy" so I will point out that I use this plenty strategy mainly at M5 but it could also applied at any time frames. So you can work with it at multiple time frames.
Currency Pair: all (preferred: EURUSD > tight spread, higher volatility)
Time Frame: 5 Min (All > see Multiple Time Frame Section, please and #72, #76 #77, #78)
Indicators: BB14, ADX14, SSD 5,3,3*, EMA 5,13,21,55,200, Pivotal Points,
Optional: CCI, RSI, MACD
(*SSD = Full Stochastics, see #8, please).
This technique is used in combination with Bollinger Bands 14,2, ADX 14 , SSD 5, 3, 3, EMA 9, 13, 21, 55, 200 and the Pivotal Points.
Buy/Sell Signals:
Entry Options:
(1) After two hollow or two filled candles;
(2) If a candle closes at the other side of EMA13;
(3) At EMA9/EMA13 crossover.
(4) Entry ahead of Time. See "Trade Examples", please. (Here you have higher risk but you make also more profit)
Leading indicator: SSD 5, 3, 3, crosses often 1-2 bar before.
Confirmation:
(1) +DI/-DI-line-crossover. +DI (green) and -DI (red) line (ADX 14) crosses sometimes 1-4 bars afterward entry point and the ADX value crosses the 20 line and the 25 value;
(2) The EMA9/EMA13 crossover.
Price Momentum:
+DI stays on top of -DI — uptrend is in place.
-DI stays on top of +DI — downtrend is in place.
Strategical ideas:
ADX -/+ DI lines are used for spotting entry signals.
All -/+ DI crossovers are disregarded while ADX remains below 20.
Once ADX peaks above 20 a buy signal occur when +DI (green) crosses upwards and above -DI (red).
A sell signal will be the opposite: -DI would cross +DI downwards.
Exit Points:
(1) At the second bar when the candles has change its color, or
(2) when the bar closes over the counterpart side of EMA5 or EMA13 line, or
(3) at the EMA5/EMA13 crossover;
(4) In all situation of +DI/-DI-line-crossovers (when trend is changing - two DI cross).
(5) Near the Pivotal Point.
- Buy and exit situations are often signalize with SSD 5, 3, 3, crossing near 20 or 80 % line;
Note:
- ADX indicator is never traded alone, but rather in combination with other indicators and tools. ADX indicator most of the time gives much later signals comparing to faster reacting moving averages crossover or Stochastic, for example, however, reliability of ADX indicator is much higher than for other indicators in traders' toolkit, which makes it a valuable tool for many Forex traders.
- If ADX is traded above 20 but below 40, it is time to apply trend following methods. An example would be: Forex trading Moving averages or trading with Parabolic SAR indicator.
- When ADX reaches 40 level (5-min-chart – e.g. ADX 50-level on 1-min-time-frame), it suggests an overbought/oversold (depending on the trend) situation on the market and it is time to protect some profits of at least move Stop loss order to a break even. See here more at SSD 5,3,3.
- When ADX passes 40 level, it is a good time to begin collecting profits gradually scaling out of the trades on rallies and sell-offs and protecting remaining positions with trailing stops. Looking at SSD 5,3,3.
Keep an eye on the clock:
Pay attention to London open (6 to 8 A.M. London time), the New York open (6 to 8 A.M. New York time) and the London close (5 to 6 P.M. London time). The markets move when these traders open and close their trades for the day.
Multiple Time Frame:
M5-Two-Way-Confirmation-Strategy is a manual trading strategy. Trades could be triggered within different time frames also(e.g. M15, M30, H1, H4, Daily and then at all currency pairs) and can used in ranging and in trending markets. M5-Two-Way-Confirmation-Strategy has used since 2006. You can use M5-2-WCS in combination with the price action (e.g. engulfing patterns, hammers, shooting stars, in bars). It's simple and efficient! If you will get other arguments more, so look at the extreme points at the pivotal points. The EMA lines will show you apart from price action momentum and if there is either a trending environment or a ranging market. (See also "Trade Examples" - "MTF").
Templates & Indicators:
See attachment, please.
Live Trading
Orders are often published in live.
Trade ExampleS
EURUSD, M5, 2011 June 05, p.1, #2 -#7 ; Entry ahead of Time: EURUSD, H5, 2011 June 06, p.2, #17; Entry ahead of Time: Silver, M5, 2011 June 06, p.2, #18; USDJPY, M5, 2011 June 06, p.3, #43, p.4, #47; LCrudeJul11, M5, 2011 June 07, p.3, #44, #45, p.4, #46; "MTF"-GBPCHF, Daily, 2011 June 09, p.6, #85/GBPCHF, M30, 2011 June 11, p.7, #94; "MTF"-Silver, M5/M30, 2011 June 10, p.7, #92; Range Bound Trading - Picking up the Tops and Bottoms at the Bollinger Band, EURJPY, H4, 2011 June 11, p.7, #95; CCI-Divergence, CADJPY, H4, 2011 June 29, p.18, #256;
FX Knowledge & Strategies:
http://www.babypips.com/school/
http://forex-strategies-revealed.com/basic
http://www.investopedia.com/dictionary/default.asp
Articles & Links:
Forex Day Trading Using Price Action And Pivot Points, p.2, #24; Price Action Trading - Waiting For Confirmation, p.2, #25; How to Find Profitable Forex Systems, p.2, #26; 5 Minute Intraday Trading Strategy, p.2, #28; Volatility Stop Loss, p.3, #37; Average True Range, p.3, #38; Average Directional Index (ADX). How to interpret ADX. How to trade with ADX., p.3, #40; Forex Trading Strategy #2 (Parabolic SAR + ADX), p.3, #41; Forex ADX Indicator Explained, p.3, #42; Trading Using Multiple Time Frames, p.6, #77; How to Use Multi Time Frame Analysis When Trading Forex, Futures and Stocks, p.6, #78; Trading the Inside Bar Strategy in Forex, p.6, #87; Inside Bar Trading Strategy, p.6, #89; Know Your Trading Environment, p.7, #96; Bollinger Bands, p.7, #97; Bollinger Band Width And Trading Ranges, p.7, #98; How To Use Bollinger Bands (BB) In Forex, p.7, #99; Basic Bollinger System, p.7, #100; Forex Trading Hours, p.12, #166; How To Become A Successful Part-Time Forex Trader, p.12, #167; FX Exit Strategies: Keeping Your Profits, p.12, #168; Forex Price Action - Reading the Language of the Market, p.12, #174 -#181;
Demo Account:
Deposit: 25'000.-$, Beginning Date: 2011 June 14, Target: 250.-$ per Day (1% per Day).
Limited Period: 4 Days a Week (1'000.-$) / 4 Weeks a Month (4'000.-$) / 10 Months a Year (40'000.-$).
Actual:
2011 June 23 Equity: 36.516.-$, Profit: + 11.516.-$
http://twitter.com/#!/forexcube
http://www.forexfactory.com/forexcube
http://www.myfxbook.com/members/Forexcube
Closed Accounts:
When 100% Profit is made Accounts will be closed.
Deposit: 10'000.-$, Beginning Date: 2011 June 21, "Turbo-High-Risk-Scalping-Account", 2011 June 23 Equity: 20'846.48$, Profit: + 10.846.48
Indicator trustfulness? Whatever seems to work for you is fine!
I wish you success & happiness!
FXcube
Attached File(s)