- Search Metals Mine
- 140 Results
- willkohsg replied Mar 21, 2011
i tried to scroll back, not sure if i scrolled back far enough.. i see this pattern.. but didnt see any gaps.. most probably due to not scrolling back far enough..
Price is everything Edit: its M15 GU chart scrolled back somemore and attaching another chart ...
- willkohsg replied Mar 11, 2011
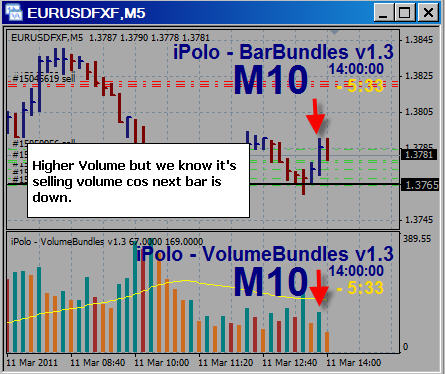
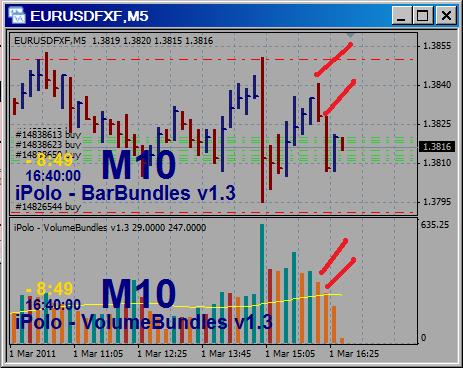
continue on.. price moved higher but we know it's selling volume cos next M10 bar can down.. higher volume up bar but nxt bar down..
vsa with Malcolm
- willkohsg replied Mar 11, 2011
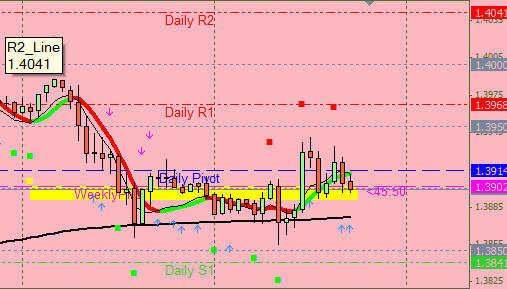
ND on M10 EURUSD break below 1.3965 for safe short...
vsa with Malcolm

- willkohsg replied Mar 10, 2011
EU M15 chart. Price seems to be consuming supply.. preparing to break UTL ?
Price is everything

- willkohsg replied Mar 9, 2011
planning to long EU, previous R become S.. PA watch..
Price is everything
- willkohsg replied Mar 8, 2011
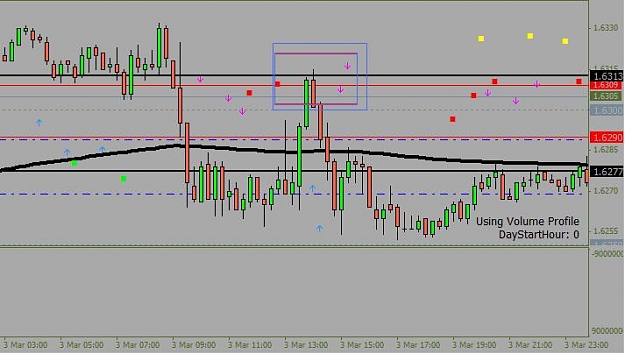
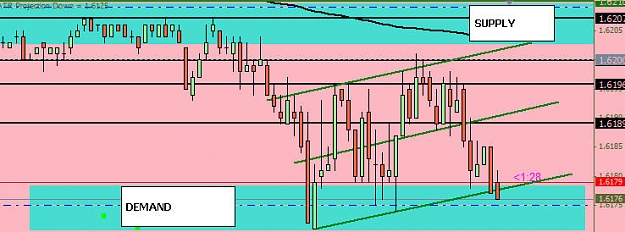
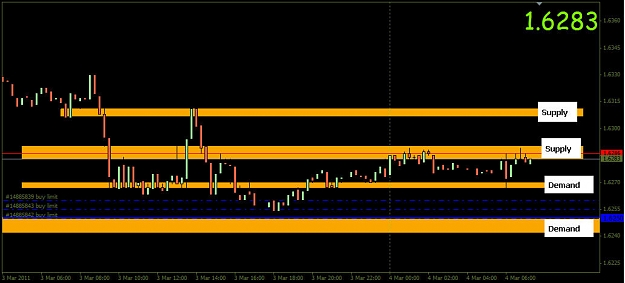
ok thanks Red, here's my chart of what i see now.. Supply @16200- 16207 Demand @16180- 16170
Price is everything
- willkohsg replied Mar 4, 2011
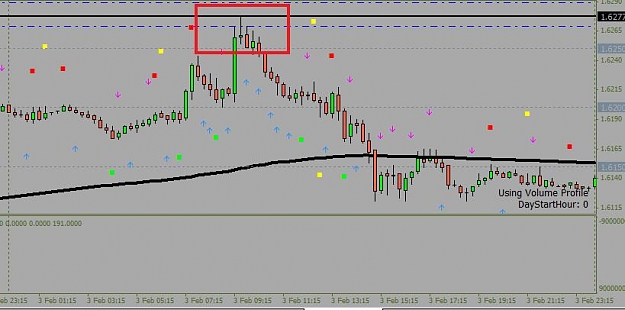
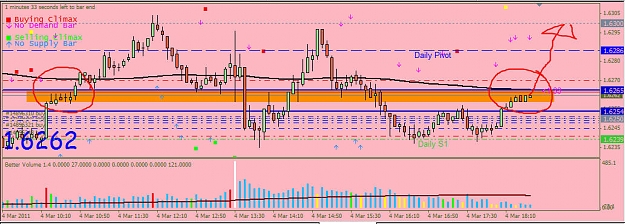
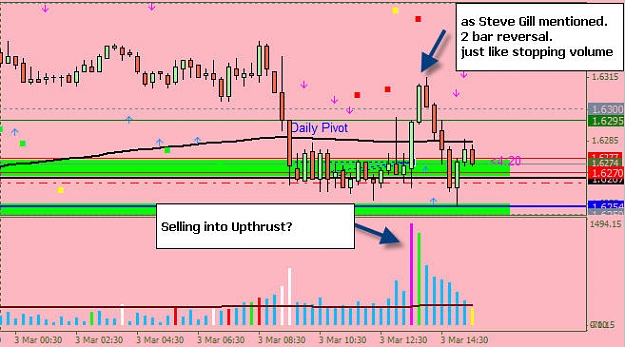
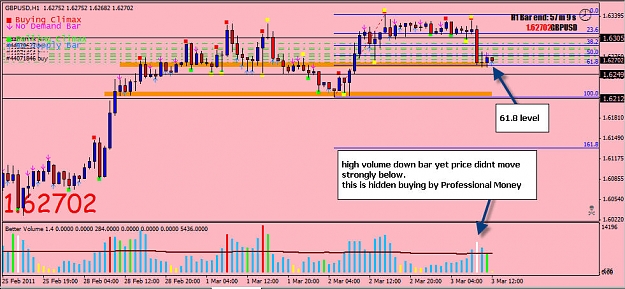
GU @Demand — GU @ Demand. Long 1.6249 1st tg 1.6270 2nd tg Daily Pivot 1.6285
Price is everything
- willkohsg replied Mar 4, 2011
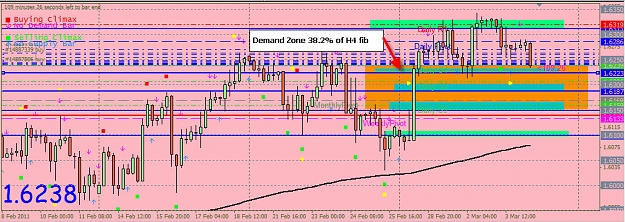
Is GU at similiar Demand zone at H4 ? chart attached..
Price is everything
- willkohsg replied Mar 4, 2011
nice
Price is everything my buy limit orders triggered
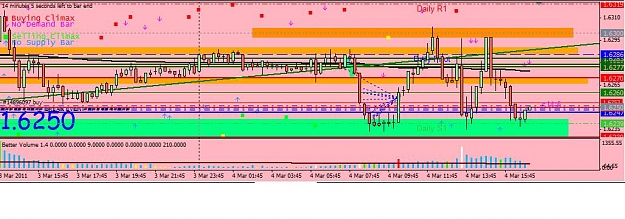
  should have tg here but wasnt too sure btw GU broke H1 TL it's a London Shakeout, shaking out the weak longs... to prepare for NFP rocket
- willkohsg replied Mar 4, 2011
Thanks for update
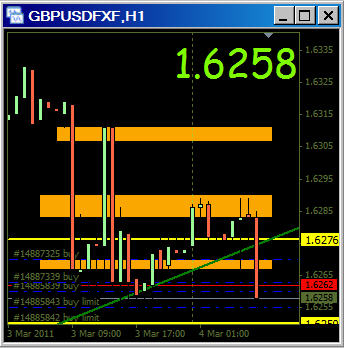
Price is everything — Hi Budak, thanks for update on GU, here's what i see.. final barrier 1.6250 very strong.. already place some buy limit orders there for bounce up to 1.6310 level max tp area..
- willkohsg replied Mar 3, 2011
another noob question.. — Hi Steve, thanks for the advice. I am still noob in my interpretation of the volume. you're right an hourly engulfing red candle isnt strength. i guess i was looking at M15 and M30 and thought it was a low volume test ...
vsa with Malcolm
- willkohsg replied Mar 3, 2011
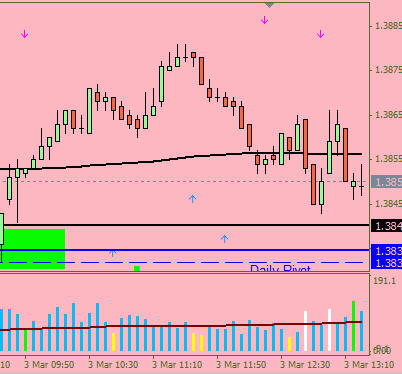
hey guys, i am confused with GU, anyone can explain what's going on now? here's a chart.. price dropping but on low volume.. looks like a test?
vsa with Malcolm
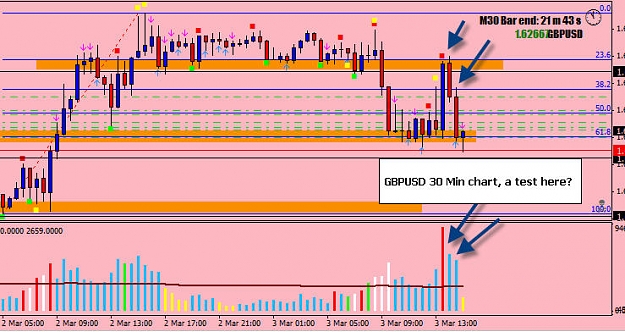
- willkohsg replied Mar 3, 2011
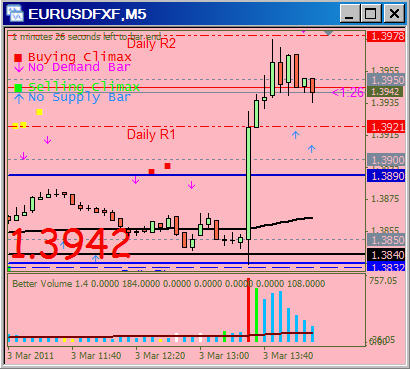
stupid question — hi guys was wondering if the more experienced VSAers here could explain with a chart what we just saw in EU just now. I seen stopping volume on M5 on EURUSD just before the rocket move attached a before and after chart on M5 ...
vsa with Malcolm
- willkohsg replied Mar 2, 2011
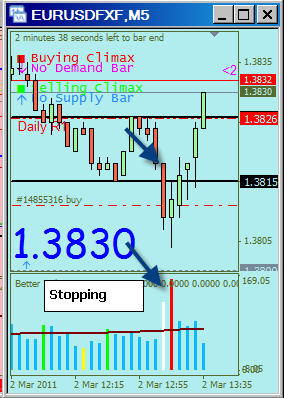
Hi guys here's my trade. feel free to comment or correct me if i am wrong, still new and learning
vsa with Malcolm saw price dipped down and a high volume bar. which was climax low. looked at the next m5 candle which was an upbar with high volume so thereby ...
- willkohsg replied Mar 2, 2011
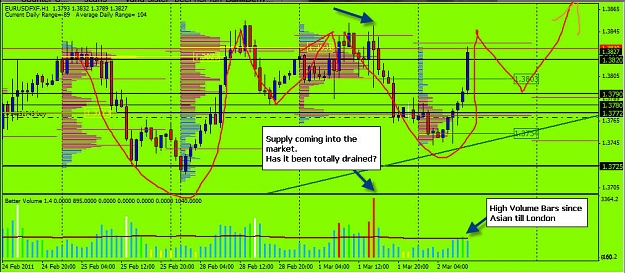
hi guys, here's my take on EU today. I was underwater as i got some trades at 1.820ish to 1.810ish levels. was holding them and added some more longs at 1.3760-1.3750ish levels during the asian session. prices went on to move higher. I was looking ...
vsa with Malcolm
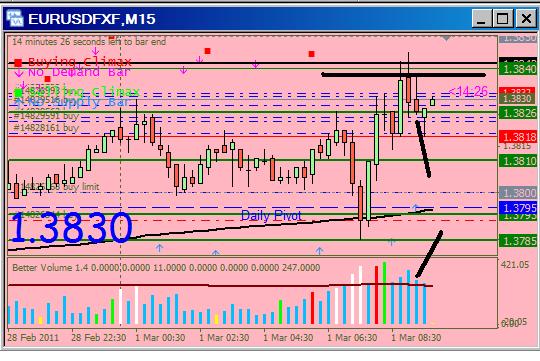
- willkohsg replied Mar 1, 2011
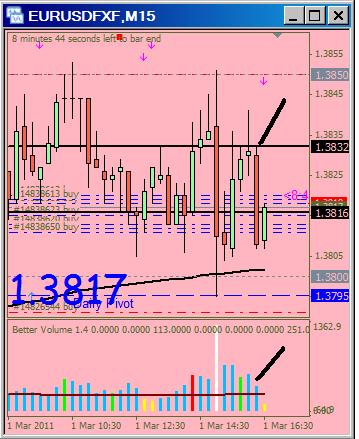
Hi guys, i spot a NS bar on last m15 candle. current m15 candle is up. will watch for volume, keep watch and once candle breaks 1.3832 will attempt a safe long. chart 1 M15 NS bar spotted chart 2 M10 2 consecutive NS bars spotted. feel free to ...
vsa with Malcolm
- willkohsg replied Mar 1, 2011
Hi Steve Gill, thanks for pointing that out. I went to look at M5, there's one that adheres to what you mentioned. the last 5 min candle with volume less than the previous 2 bars. could u comment on this? thanks in advance
vsa with Malcolm EDIT: M5 NS bar did not ...
- willkohsg replied Mar 1, 2011
hi guys, i spotted another NS on M15 chart for EURUSD, next candle became a pin bar and moving up. marked high of NS candle which was 1.3838, so a break of this level will be a safe long ? feel free to comment thanks. Note: i went long once price ...
vsa with Malcolm
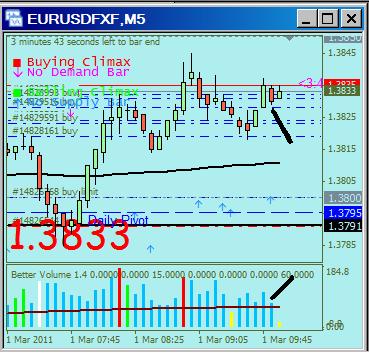
- willkohsg replied Mar 1, 2011
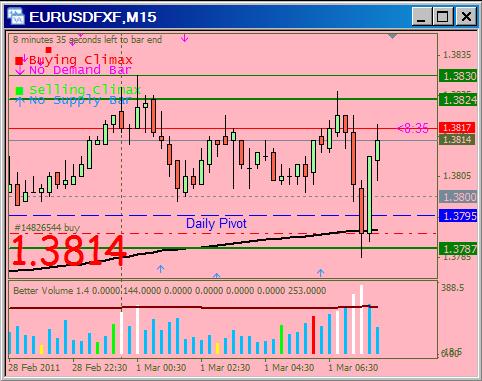
Pre-London Open and we saw price moved down to beyond 1.3800 for a shakeout, went to as low as 1.3785 price had 2 high volume wide spread down candles during pre-london and we saw a reversal up bar on lower volume just before london open. right now ...
vsa with Malcolm