- Search Metals Mine
- 52 Results
-
 waleed.khan replied Oct 20, 2014
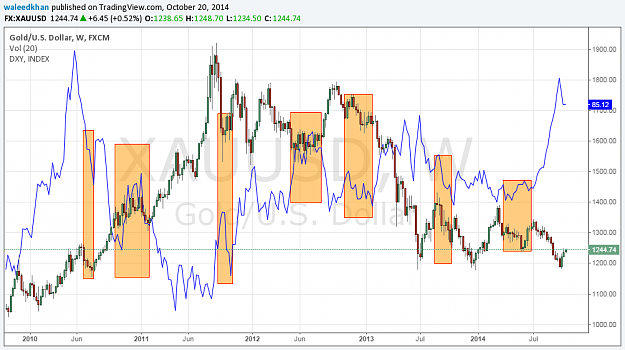
HI griffinssoul Please see the XAUUSD 5 year chart with an overlay of the USD INDEX below. The USD INDEX is marked in blue. The Boxes marked in peach/beige are the times when the inverse relationship is broken. I think the inverse relationship is ...
Only Gold!
- waleed.khan replied Oct 20, 2014
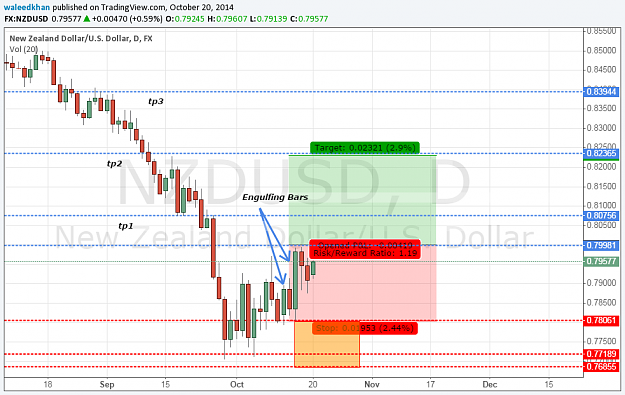
Hi everyone! I think NZDUSD is indicating that it wants to retrace now, as per price action candles marked in the chart. url url I have marked 3 target areas on the chart... Good Luck!
NZD/USD
- waleed.khan replied Oct 20, 2014
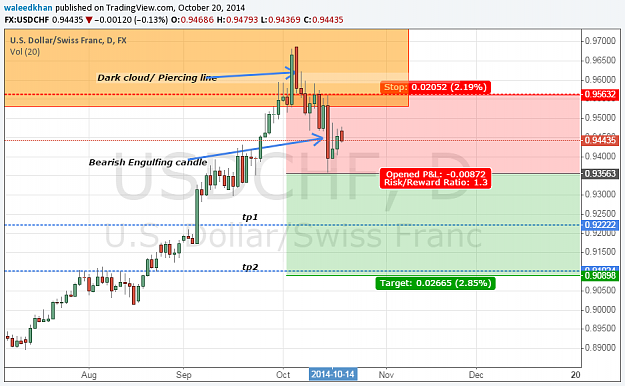
Hi everyone I expect near term bearishness in this currency pair... Please see the chart for price targets Cheers url
USD/CHF
- waleed.khan replied Oct 9, 2014
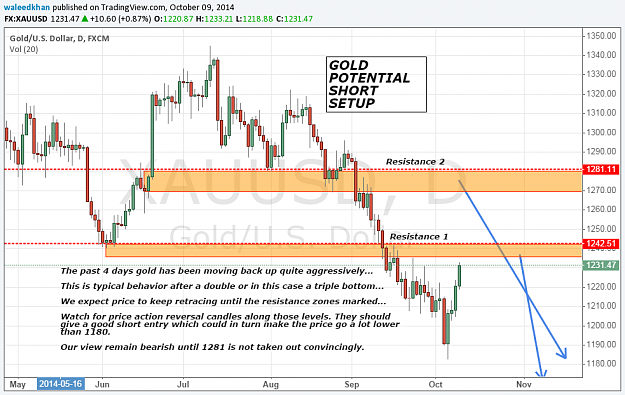
url The past 4 days gold has been moving back up quite aggressively... This is typical behavior after a double or in this case a triple bottom... I expect price to keep retracing until the resistance zones marked... Watch for price action reversal ...
Only Gold!
- waleed.khan replied Sep 19, 2014
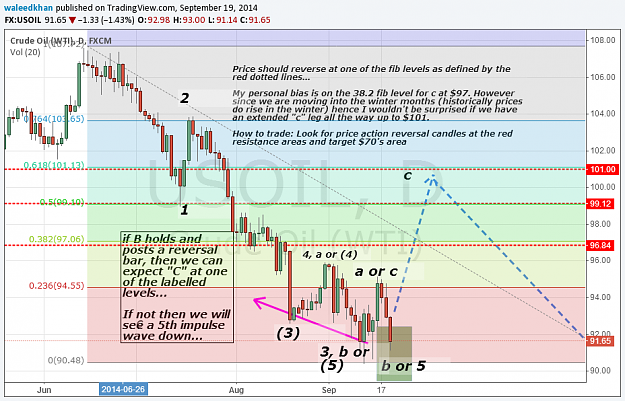
Hi everyone... its's been a while since i've posted here... this is the latest of what i've got: url Right now there are 2 possibilities...1) oil continues to sell of to complete the 5th leg, or then price must retrace to the marked areas if it ...
US Crude Oil with smart VSA and Dark Seasons [only]
- waleed.khan replied Sep 16, 2014
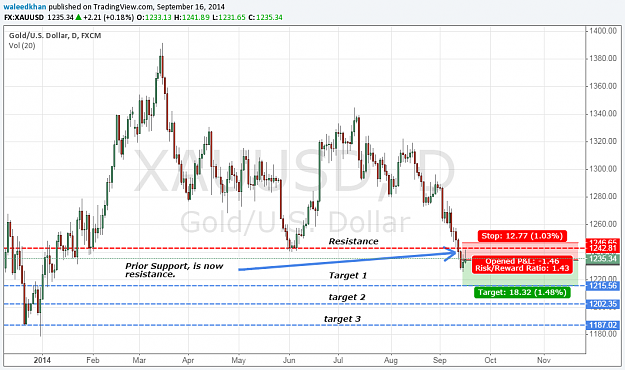
Gold seems to have bounced off its resistance area and appears weak around the resistance at 1242.8. It is worth going short at these levels with stop loss above 1243-46 and aim for 1180 - 1215. However one should be careful by not risking to much ...
Only Gold!
- waleed.khan replied Sep 9, 2014
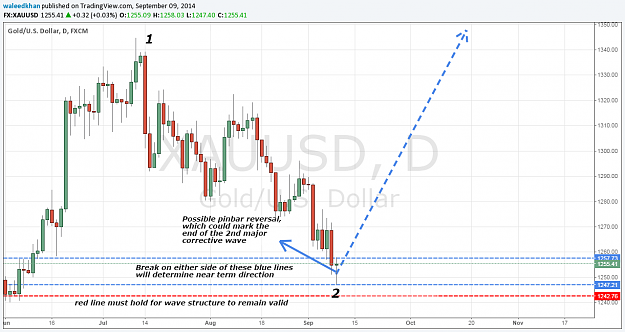
Agreed. This is how I am seeing it right now. If price breaks the top dotted line then we could be in for a rally and the possible start for the 3rd impulse wave. However if price slips below then the entire impulse wave structure was wrong. url
Only Gold!
- waleed.khan replied Sep 8, 2014
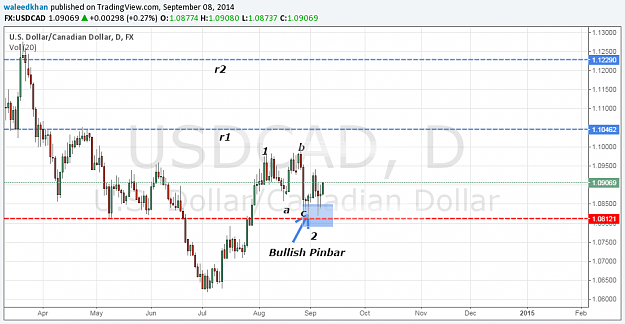
USDCAD has been consolidating sideways for a number of days now. We believe that it will start to move higher now as it has already retraced 50%, plus posted a bullish pinbar. USD CAD has a lot more room for the upside and this could perhaps be the ...
USD/CAD
- waleed.khan replied Aug 15, 2014
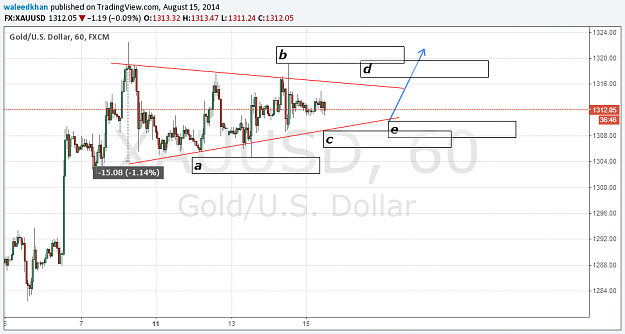
Update to the pattern... I realized the first one was actually wrong (as I did it in a hurry). Lets see if this pattern holds; if it doesn't then it might turn into a triple abc flat... ( a pattern similar to the recent usdcad breakout that occurred) ...
Only Gold!
- waleed.khan replied Aug 14, 2014
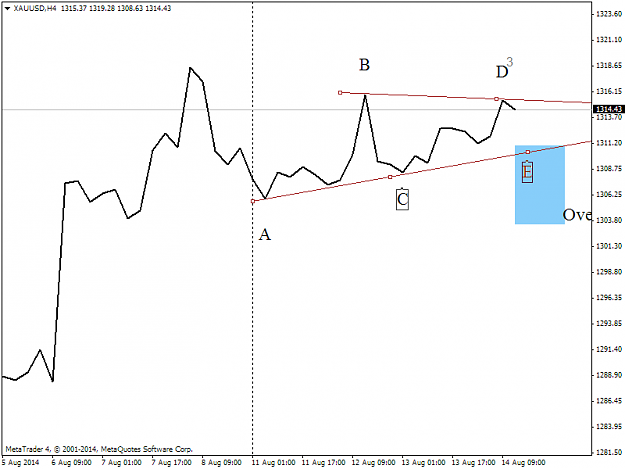
Gold possible abcde on 4 hr chart before a bullish run as long as D top (1315.2) holds... url url *This count can also be looked at as a flat (abc) with a triangle BC...doing that would increase the count on the waves and might change the shape ...
Only Gold!
- waleed.khan replied Aug 13, 2014
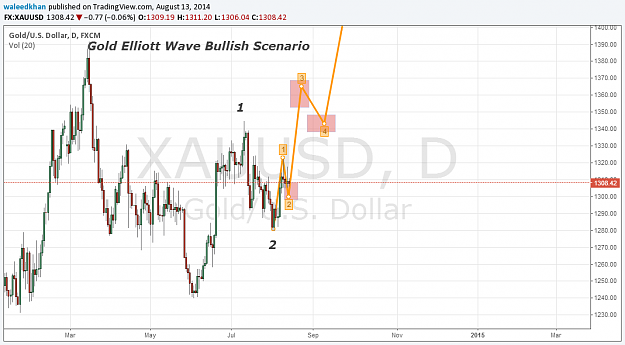
After my last corrective count was invalidated; it now seems that a bullish impulse wave is in process. We are right now at the start of the 3rd impulse wave which should take price to 1340-60 region. Note: 1293-95 must hold for this count to remain ...
Only Gold!
- waleed.khan replied Aug 6, 2014
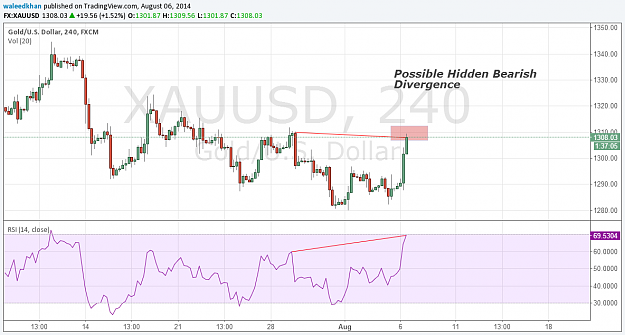
Possible not confirmed....(wait for the 4hr candle to close) *also it should be noted that the S&P amd nasdaq seems to have reversed for the time being...Oil is not moving much & neither is silver*
Only Gold!
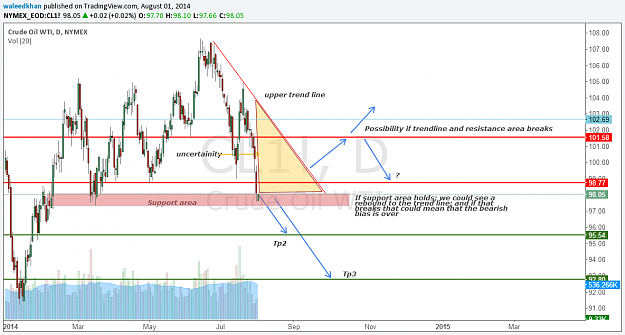
- waleed.khan replied Aug 1, 2014
Possibility map after target 1 was hit! This is a critical support area for crude oil; if price holds then we could move sideways for a couple of days... However if we do get a close above the upper trend line then perhaps it is reasonable to assume ...
US Crude Oil with smart VSA and Dark Seasons [only]
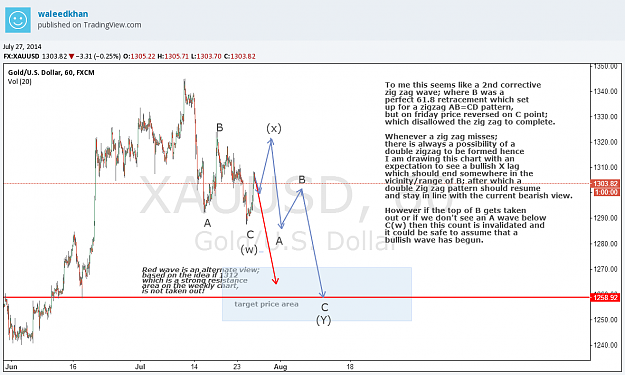
- waleed.khan replied Jul 27, 2014
To me this seems like a possible 2nd corrective zig zag wave; where B was a perfect 61.8 retracement which set up for a zigzag AB=CD pattern, but on friday price reversed on C point; which disallowed the zig zag to complete. Whenever a zig zag ...
Only Gold!
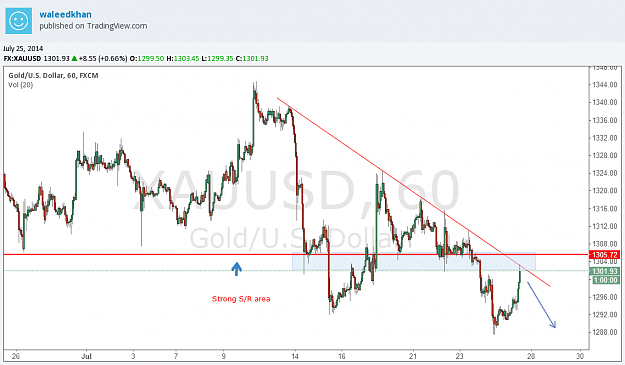
- waleed.khan replied Jul 25, 2014
I think this is still a good trade based on R/R. As long as one risks the appropriate amount and not get carried away with it
Only Gold!
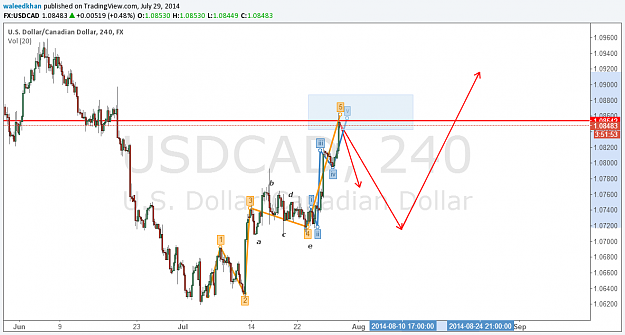
- waleed.khan replied Jul 25, 2014
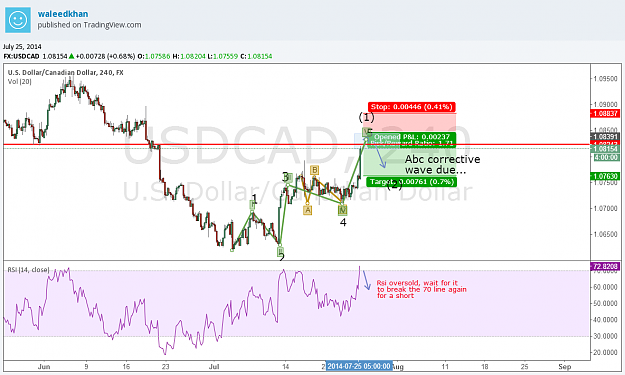
Hey guys... So I am just updating my elliottwave count... Might be a good time to short as the pair will meet resistance in the short term; wait for a confirmation when the line breaches the overbought line again... Cheers!
USD/CAD