- Search Metals Mine
- 33 Results
-
 synicz replied Dec 22, 2018
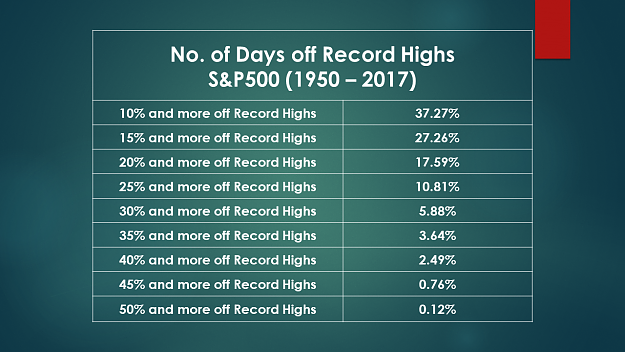
Here is an interesting finding to mull over the weekend. image The table above shows the number of days which S&P500 closes away from record high levels. This is given in percentage form to give context. We can see that the number of days spent ...
Macro & Market Developments, Discussion & Analysis
- synicz replied Dec 17, 2018
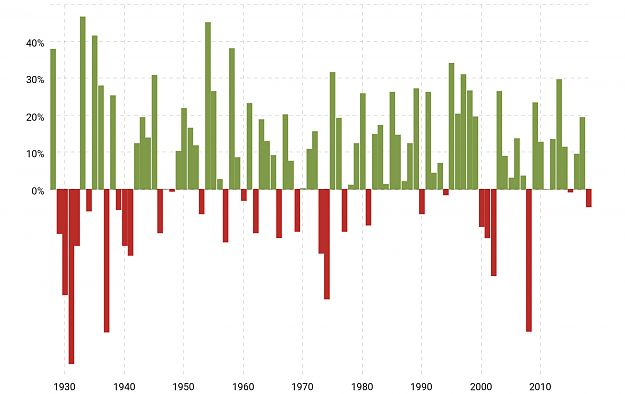
Interesting statistic which I found: From 1928 - 2017 (89 year period). S&P500 have had 28 losing years. This means we have a 31.5% chance of a losing year at any given year. Empirically, the probability of a subsequent losing year following a ...
Macro & Market Developments, Discussion & Analysis
- synicz replied Aug 18, 2018
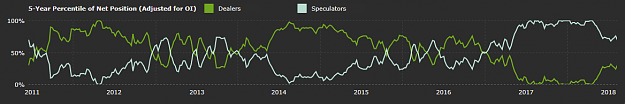
18/08/2018 --- Found something rather interesting. Below is the COT data for Eurodollar futures. image As we can see, the net positioning of trades came off record percentile highs recent months. Suggesting speculators might be taking profits. ...
Training Journal
- synicz replied Aug 15, 2018
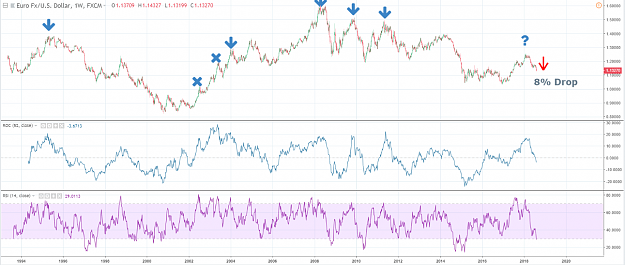
15/08/2018 --- No trading for me today as I wait out this drawdown that I am in. Thought it would be fun to do a Technical Analysis revisit. Below is a fun post I made on 29 December 2017. Basically TA tells me that EURUSD will drop by at least 5% ...
Training Journal
- synicz replied Jul 24, 2018
One up and coming trend on the forum have been the use of pivot points. This could be attributed mainly to Davit, whom sadly has left the forum. It is really a shame as he really has made significant contribution to the forum. On this post, I would ...
Training Journal
- synicz replied Jul 17, 2018
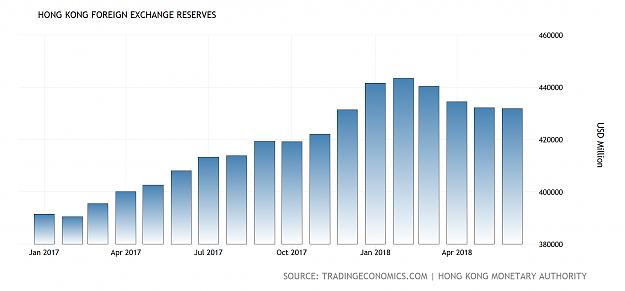
I am taking a relook at USDHKD pair as I have a trade thesis which could play out in time. With the rising USD, it is getting increasingly more expensive for HKMA to maintain their peg. Take a look at the FX reserves of HKMA. image We can see that ...
Training Journal
- synicz replied Jun 28, 2018
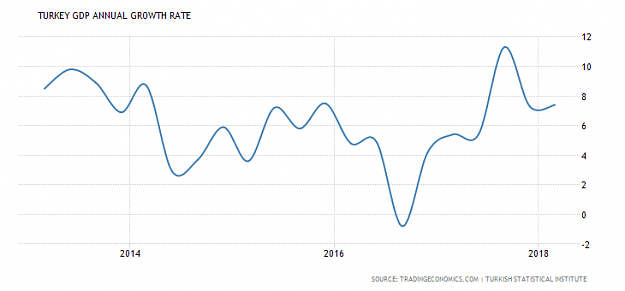
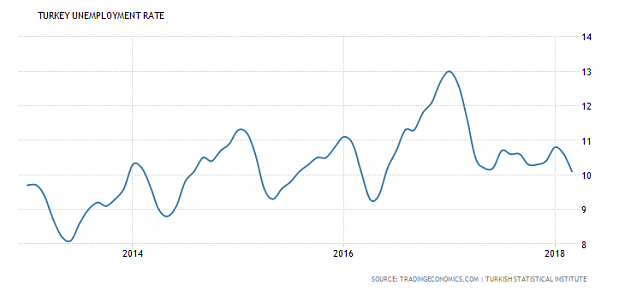
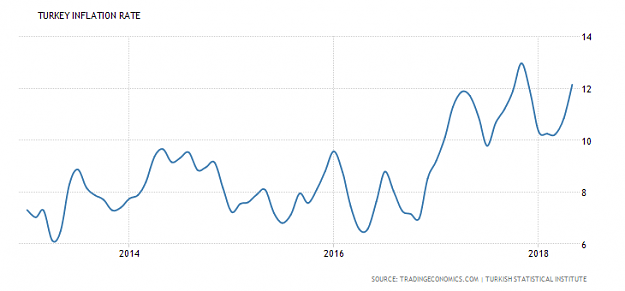
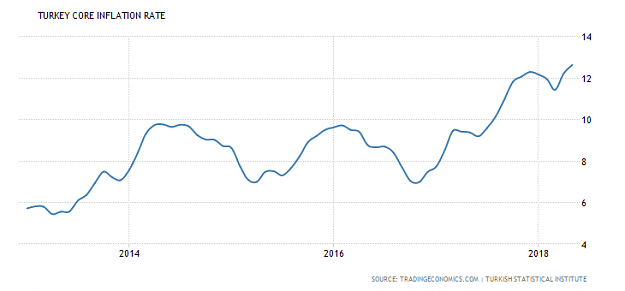
28/06/2018 --- My attention has been brought to the possible undervaluation of the Turkish Lira. Due to political instability with their president. the Lira sold off heavily in recent times. That selling seemed to be curtailed by the aggressive ...
Training Journal
- synicz replied May 25, 2018
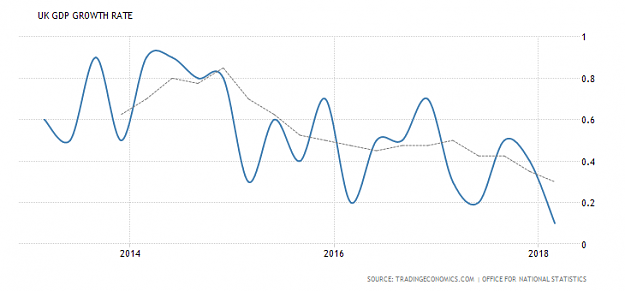
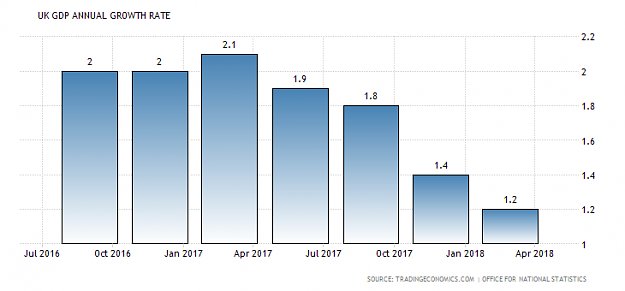
25/04/2018 --- Looking though th GDP growth rate for the UK over a 5 year basis. Below is the chart of the growth rate with a 4-period Moving Average to smooth out the results. Guess we can safely say that growth trend is slowing! Makes me wonder ...
Training Journal
- synicz replied May 17, 2018
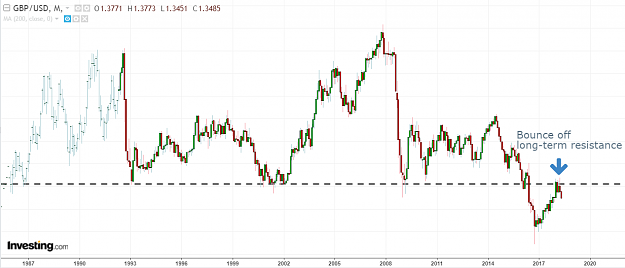
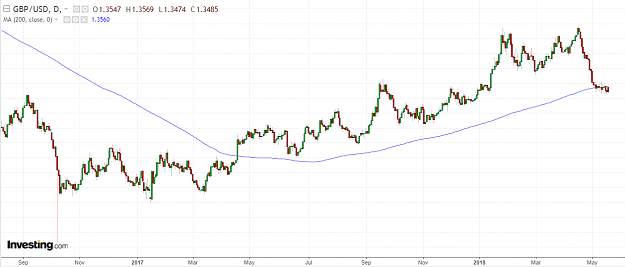
Nothing constructive to talk about in the markets today. Hence I shall revisit a fun-post I had made in march! Quoted above was the original post dated 22nd march. A thought provoking chart of GBPUSD showing price approaching a super long-term ...
Training Journal
- synicz replied Apr 30, 2018
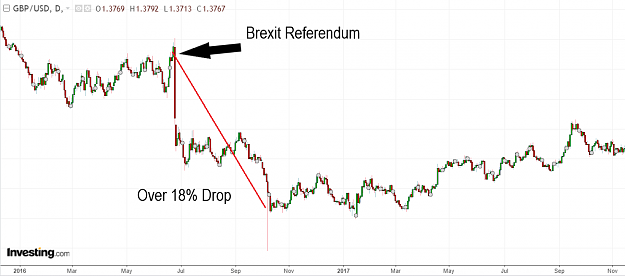
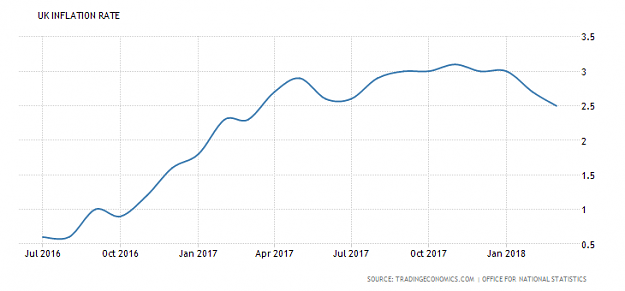
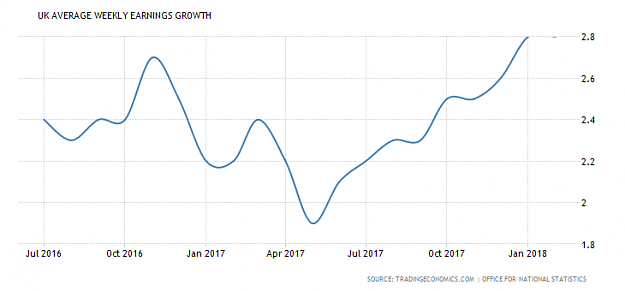
Not sure if this counts as pure brexit talk but I shall make my case. I honesthonesthonestly cannot see how Brexit can be good for the pound. It is a politial dilemma on both parties as to what action to take. Allow me to make my case by first ...
Brexit and its potential impact on the value of sterling...
- synicz replied Apr 1, 2018
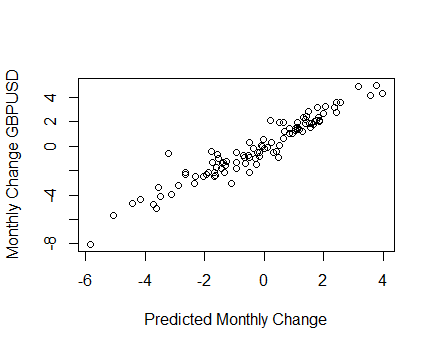
2/4/2018 --- Spent last night trying to improve on my forecast model. I think I made some major progress! image This scatterplot shows the predicted monthly returns of GBPUSD versus the actual returns of GBPUSD. Test result shows an directional ...
Training Journal
- synicz replied Mar 24, 2018
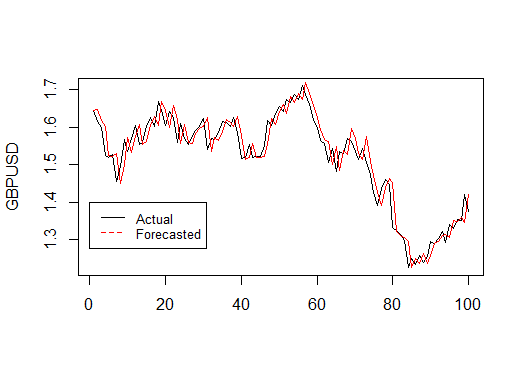
25/03/2018 --- Im not sure what got the better of me, but I spent the entire day developing a forecast model for the GBPUSD. My inspiration for the model actually came from some of the posts on this forum! The hypothesis behind my model was ...
Training Journal

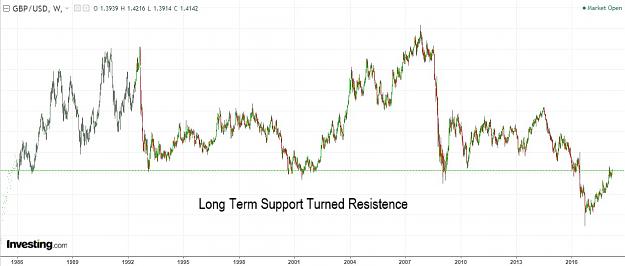
- synicz replied Mar 22, 2018
As much as I am an outright anti technician. It is sometimes fun to post thought provoking charts! Here is one for all you chartist out there. image Below is a weekly chart of GBPUSD. As you can see we are around a level that was once a strong ...
Training Journal
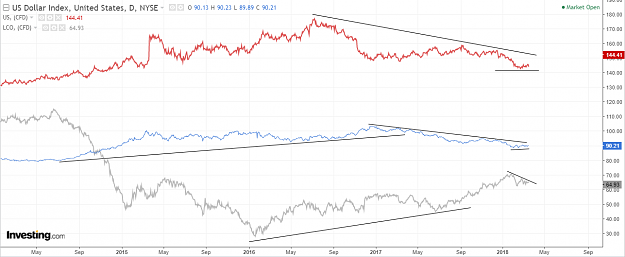
- synicz replied Mar 16, 2018
16/03/2018 --- I will be rather busy the next couple of days. So I might not have time to watch the markets. This is just a "food for thought" post. Below is a daily chart of Dollar Index (Blue), Light Crude Oil Futures (Grey), and T Bond futures ...
Training Journal
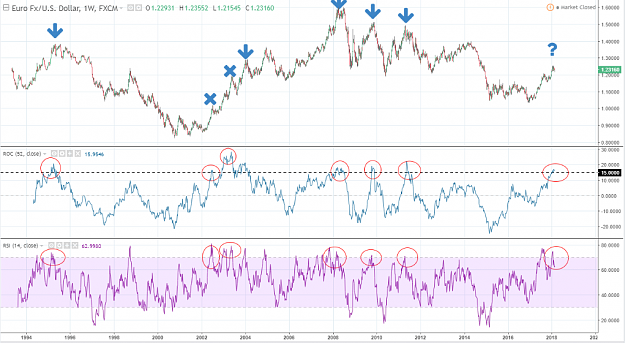
- synicz replied Mar 3, 2018
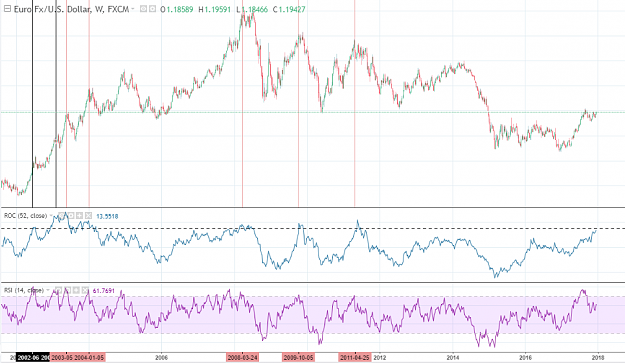
Just revisiting a chart from 2 months back. EURUSD Weekly with 52 period ROC and 14 period RSI. Whenever ROC crossed 15% mark and RSI crossed 70, 7 times this occured in history, 5 times EURUSD fell by at least 5%. The recent crossover and crossdown ...
Training Journal
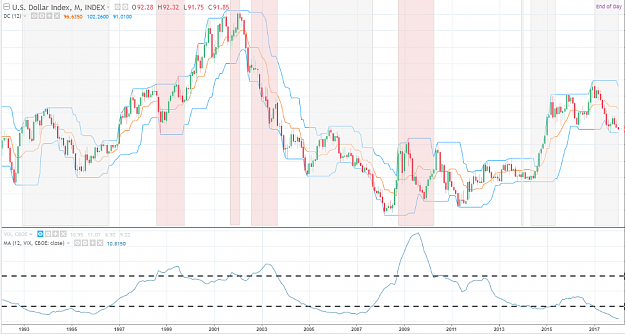
- synicz replied Jan 5, 2018
05/01/2018 --- Was playing around with charts today and found something interesting. Below is a monthly chart of the DXY from 1993 till today. Under it is the 12 period Moving Average for the VIX index. The grey areas are points in time where the 12 ...
Training Journal
- synicz replied Dec 28, 2017
29/12/2017 --- Another chart to make you wonder. Below is the weekly chart of EURUSD with 14 period RSI and 52 period ROC. 5 out of 7 times which RSI crosses over 70 and ROC is over 15%, prices will reverse by at least 5%. Coincidence? image ...
Training Journal
- synicz replied Dec 24, 2017
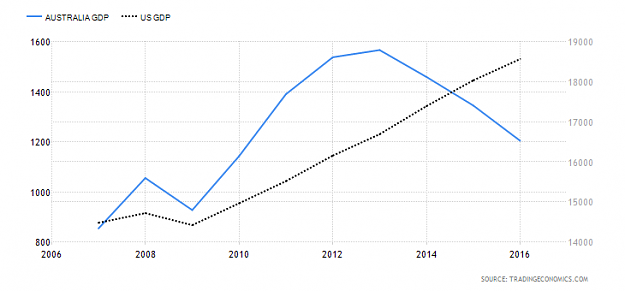
24/12/2017 --- My next trade idea is to short AUDUSD. My reasoning are stated below: image We are starting to see a divergence between the central banks interest rate. With the fed hiking interest rates since dec 2015, and are expected to continue ...
Training Journal

- synicz replied Aug 28, 2017
Firstly I want to explain my reasoning for going long on gold. Primary reason is the drama in the white house. With DT threatening to shut down the govt and members resigning, I believe that investors will be shorting usd. This has the most ...
Training Journal
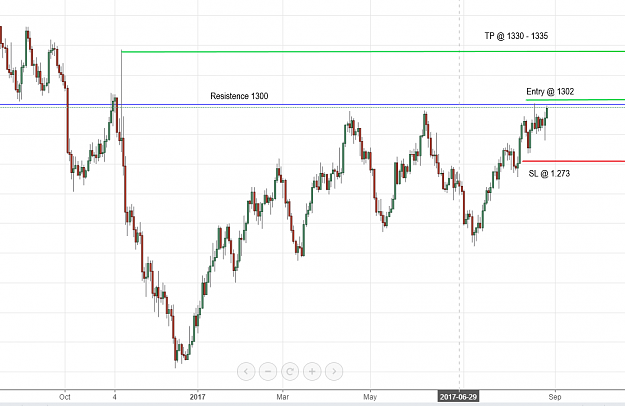
- synicz replied Aug 12, 2017
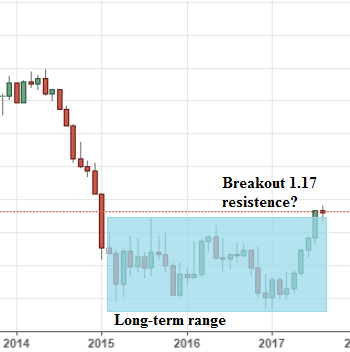
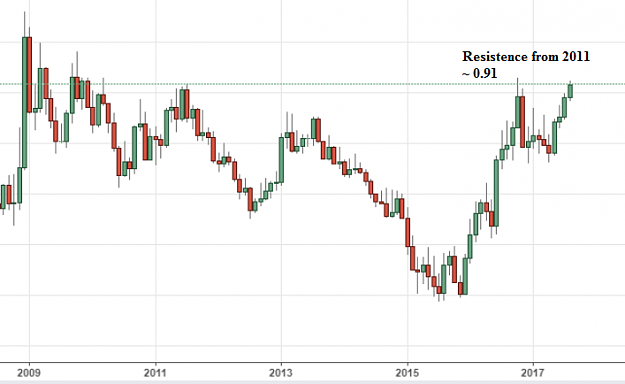
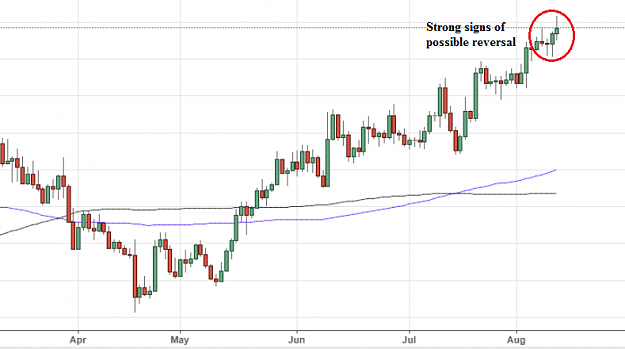
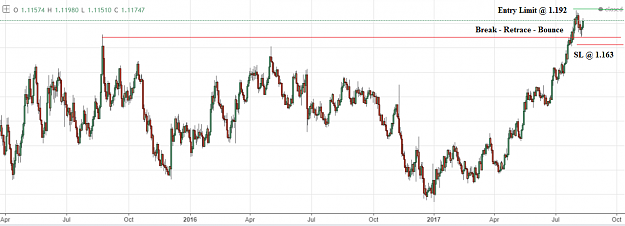
12/08/2017 _________ And my Eur battle plan is ready. Looking through both eurgbp and eurusd, I must say that eurusd looks like a higher probability trade from a techical perspective. Eurgbp is at a long-term resistence level. You can see from the ...
Training Journal