- Search Metals Mine
- 22 Results
-
 steviet replied Jul 4, 2010
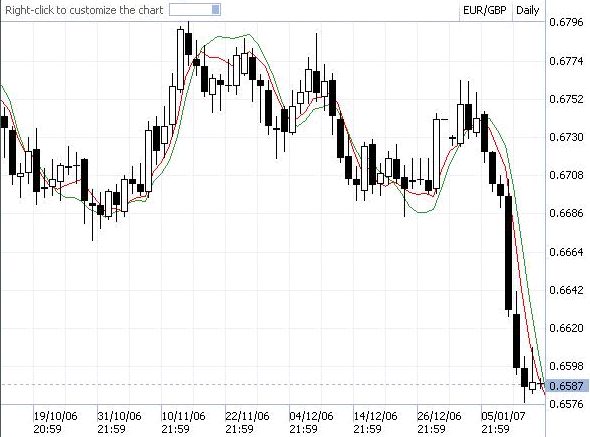
Chart — OK, here is the chart I use on EU daily for my entries - sorry about the quality but I've forgotten how to crop an image in paint so it's as good as it's going to get. (Edit, actually looks OK if you click on it
Steviet's Live Trades! ) The white line is ...
- steviet replied Apr 13, 2010
Hi Luca, The daily method basically revolves around the 50sma. I use Alpari for charting as this does not include a Sunday bar which skews the ma's. As you can see I've been short on EU since 7th December 2009 and will be until we get a daily close ...
Steviet's Live Trades!
- steviet replied Jul 10, 2009
Exit — OK, hopefully this will work lol. I'm going back to June 24th when we had a +6.65% day to explain exit. Firstly I've circled the opening Frankfurt hour bar which is clearly bullish. Therefore I'm going short on London open which I did ...
Steviet's Live Trades!
- steviet replied Jun 21, 2007
Well, USDCAD is about to close above it's falling trendline since late March on both the daily and weekly charts. I have therefore opened the following medium to long term trades... USDCAD long from 1.0740 (initial s/l 1.0580) USDCAD long from ...
Steviet's Live Trades!

- steviet replied Apr 10, 2007
Trendlines UJ — Hi Iso, Tell me what you think of the attached chart for UJ daily. I'm loving these trendlines lol. My thinking is to go short on a bounce from the falling trendline or long on a hold on one of the 3 supports. Comments please ...
Steviet's Live Trades!

- steviet replied Apr 9, 2007
An 'Iso' Test Trade — Hi, As I said I would, I've been studying trend line trades similar to Isotonic's charts that we have seen through my thread. I've also been reading Jacko's posts which are pure gold. An opportunity has been spotted on ...
Steviet's Live Trades!

- steviet replied Mar 19, 2007
OK, UJ stopped out for minus 126 pips
Steviet's Live Trades! My 3rd over 100 pip stop out - not bad on my system for nearly 5 months. Attached is the UJ daily chart - if you discount today's daily bar you should see why I went short. As I said previously I may have ...

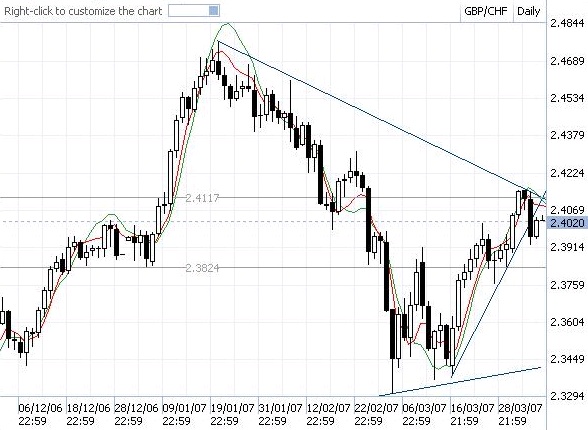
- steviet replied Mar 3, 2007
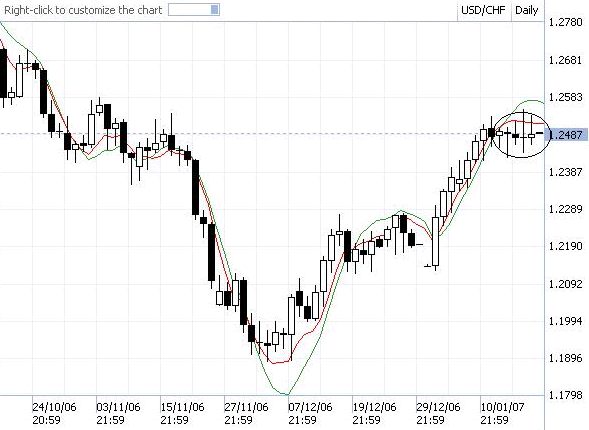
OK, Attached is the daily chart for USDCHF as promised. On backtesting, I would have used the candlestick alone and gone short but going long at Sunday open (unless it opens under 1.2145) seems the way to go with little risk involved. Backing up the ...
Steviet's Live Trades!

- steviet replied Feb 24, 2007
Hi Takisd, Agreed, stochastics look overbought on the dailys but they did also mid Nov 06 & mid Jan 07. That's why I don't take a blind bit of notice of them because as a trend starts, it can stay overbought for 500 pips or more. I managed to catch ...
Cable Update (GBPUSD)

- steviet replied Feb 23, 2007
ATR — Hi karmostaji, OK, I understand I don't need to place this on the charts but how do I get the actual ATR value? On the attached chart I've got GBPUSD daily with an ATR at the bottom period 20, ranging from 0.011 to 0.014. What do these ...
Steviet's Live Trades!

- steviet replied Feb 8, 2007
OK, three remaining trades have had stop losses tightened - will we see a profit from EU this time tomorrow? It's anyone's guess lol..... USDJPY long from 120.69 (s/l 120.48 guarantees minus 21 pips) EURUSD long from 1.2984 (s/l 1.2966 guarantees ...
Steviet's Live Trades!

- steviet replied Feb 7, 2007
My entries are based on my limited knowledge of candlestick patterns and also price action. I enter as the daily bar closes and the new one opens with my broker, which is 10pm gmt, not midnight gmt like some other brokers. In this tight ranging ...
Steviet's Live Trades!

- steviet replied Jan 30, 2007
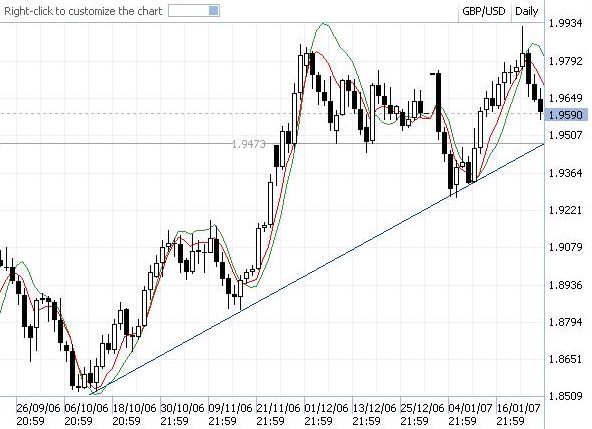
I'm favouring taking another short on GU tonight after we've virtually ended the day where we started. I would favour another test of 9555 tomorrow on good US data but it's one of the more difficult calls I've had to make. Out of my 701 pip profit ...
Steviet's Live Trades!

- steviet replied Jan 26, 2007
Every trade is run to the bitter (or better) end which is how I tested the set up initially. I never close early even if it means having a trade over 100 pips in profit reverse to break even or worse. That's why I'd be surprised if many would trade ...
Steviet's Live Trades!
- steviet replied Jan 26, 2007
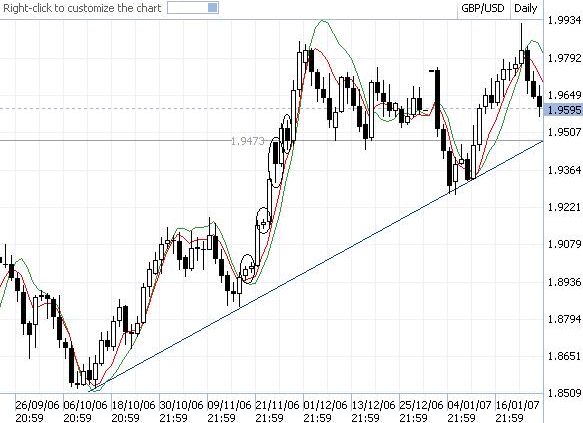
Attached is a chart for GU daily showing the rising trendline from early October 2006. It shows it's currently at around 1.9473 so there is a possibility this move could hit it again in the low 9500's if we continue down from here. Would also be ...
Daily Cable Analysis
- steviet replied Jan 20, 2007
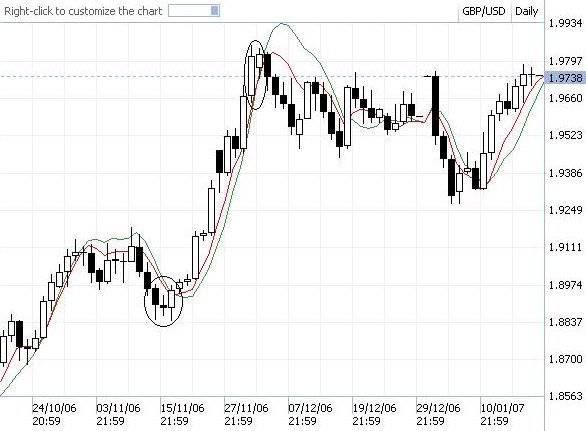
double tops / bottoms / dojis / engulfing — Hey Damien, Great thread
Trading Naked - Reading Candlesticks and other Price Analysis Saw your first example of a double bottom on the 4 hour chart for GU and thought I'd attach a daily chart from the same time. You will see that the same period ...
- steviet replied Jan 19, 2007
OK, well after a difficult week on some pairs all trades are currently open into the weekend..... USDCAD short from 1.1739 (s/l 1.1765 guarantees minus 26 pips) USDCHF short from 1.2468 (s/l 1.2541 guarantees minus 73 pips) EURUSD long from 1.2966 ...
Steviet's Live Trades!

- steviet replied Jan 16, 2007
Now it is my honour to welcome you to my thread
Steviet's Live Trades! Generally speaking they will move together although EU normally at a slower rate. The only reason I'm not GU short at the moment is the fact that my long was not stopped out - I'd be very surprised ...


- steviet replied Jan 2, 2007
My broker only opened officially at 10pm gmt tonight although it must've opened for a short time on the 1st & 2nd - gu bar just finished for example was high 1.9739 & low 1.9729. We know that wasn't the full range but as far as my broker is ...
Steviet's Live Trades!

- steviet replied Jan 2, 2007
Hi Howard, Yes, the new daily bar starting 10pm tonight is when my broker officially opens. However, yesterday & today they have created bars (see attached) as a snapshot of today's market. You will see I entered GU long at 1.9539 on 27th Dec & ...
Steviet's Live Trades!
