- Search Metals Mine
- 22 Results (1 Thread , 21 Replies )
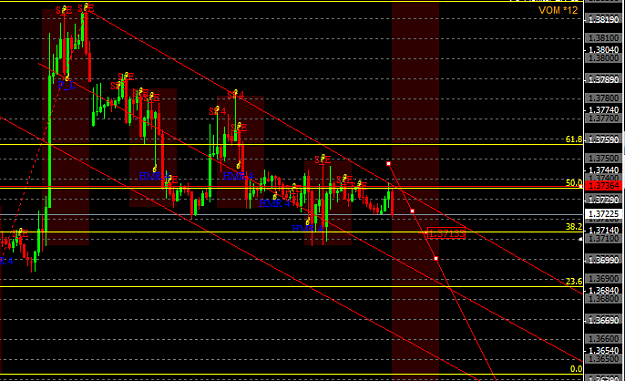
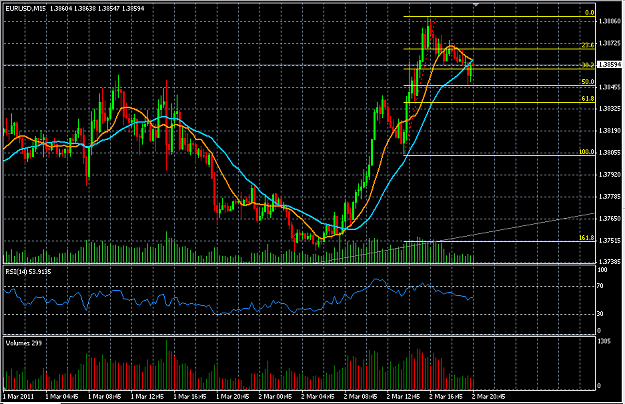
- speedster239 replied Mar 3, 2011
If we poke through the 50 percent line I'm going to go short with a 4:1 PL ratio. EDIT: Okay, here we are. Now I will time my entry on the pull back and call it a night.
EURUSD
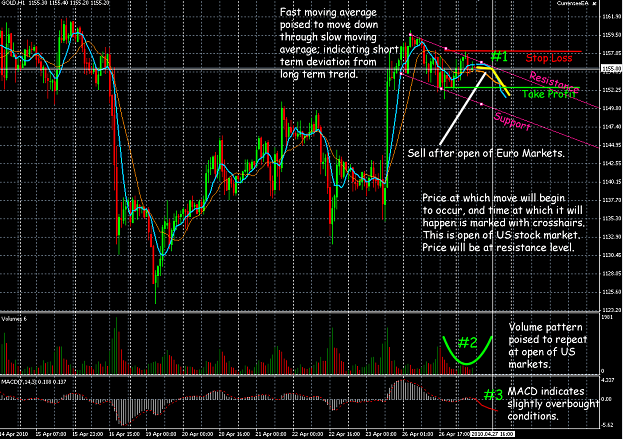
- speedster239 replied Apr 27, 2010
Here's my current outlook. Everything is explained on the graphic. The trade I've made: Sell limit at 1155.50, take profit at 1152.70 (previous low) and stop loss at 1160.10 (previous high).
Gold techniques, systems, and individual trades
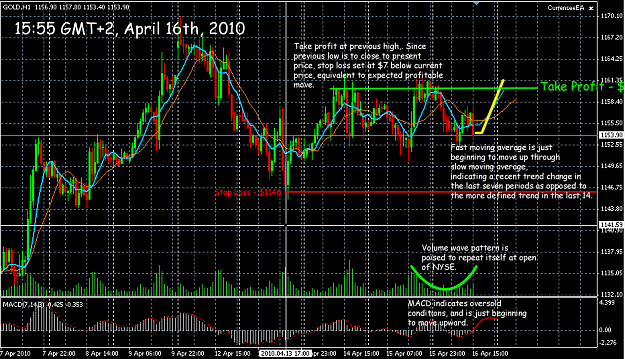
- speedster239 replied Apr 16, 2010
Here's my current outlook and present trade I just entered. Everything is explained in the graphic. EDIT: I should note that I did not enter the trade at the price level you see in the graphic. It is always wise to wait for the sell off before the ...
Gold techniques, systems, and individual trades
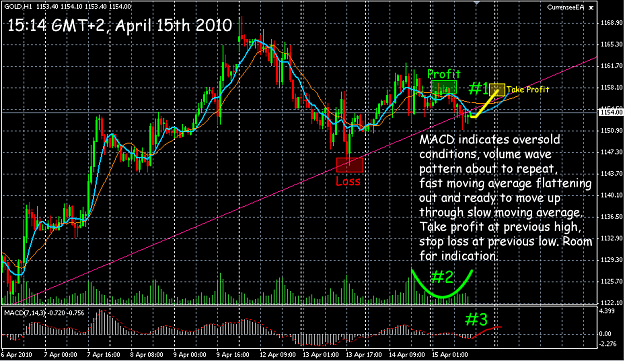
- speedster239 replied Apr 15, 2010
I just entered a buy at 1153.50 and I'm expecting to take profits around 1158. I will stop my loss at 1145 if necessary. The MACD indicates oversold conditions, the fast moving average is flattening and poised to move up through the slow moving ...
Gold techniques, systems, and individual trades
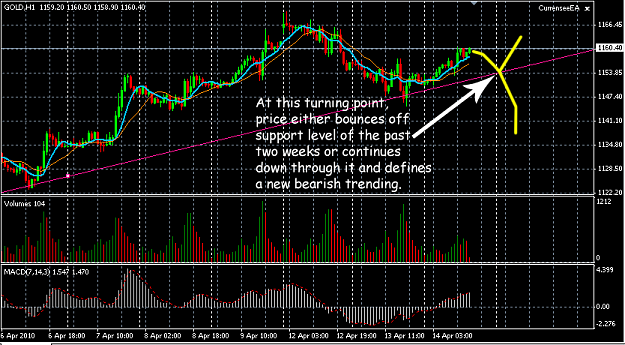
- speedster239 replied Apr 14, 2010
I just barely peaked into the profitable zone for the trade I made two days ago and I was able to take minimal profits. I'm glad I was able to learn a good lesson and not take a loss at the same time. This is definitely not a time to enter a trade. ...
Gold techniques, systems, and individual trades
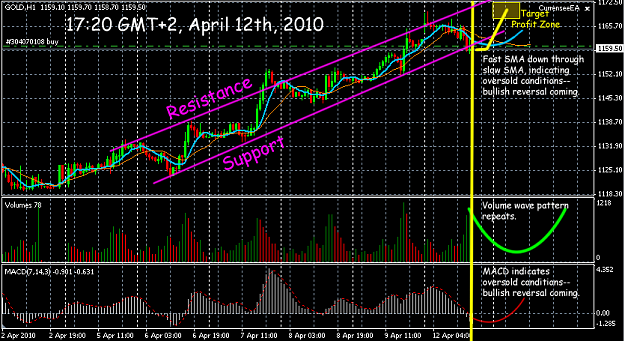
- speedster239 replied Apr 12, 2010
Here's my current outlook: The fast moving average has moved down through the slow moving average and indicates oversold conditions. The MACD also indicates oversold conditions and the volume pattern should repeat itself. The price will either ...
Gold techniques, systems, and individual trades
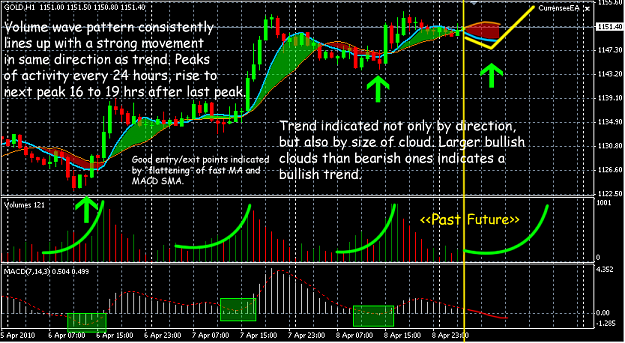
- speedster239 replied Apr 8, 2010
Here's my current outlook. I'd like to note that the peaks of volume or "tick movement" activity are almost always, consistently, 24 hours apart from one another. With that said, the next "rise in activity" (movement towards a peak) can simply be ...
Gold techniques, systems, and individual trades
- speedster239 replied Apr 5, 2010
Here's my analysis. I have to go, so I can't write a text explanation here, but the graphic is self-explanatory if you've read my others.
Gold techniques, systems, and individual trades
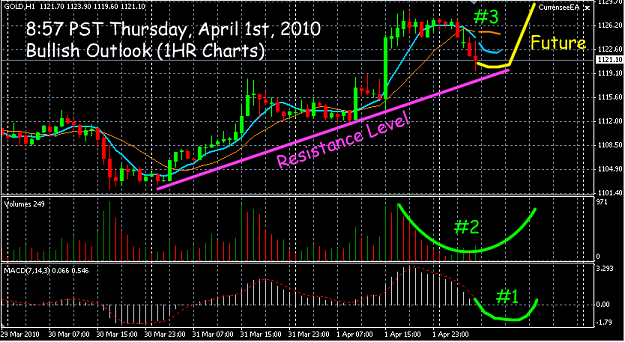
- speedster239 replied Apr 2, 2010
Current outlook. I expect the bullish move to take place at the open of the US markets.
Gold techniques, systems, and individual trades
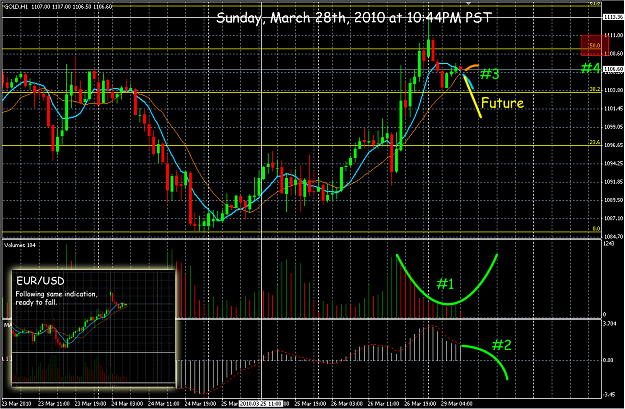
- speedster239 replied Mar 29, 2010
I believe it's going to find resistance at the more recent trendline that you drew. On the Fibonacci retracement it seems to have found resistance at the 50. I'm going to be placing a sell based on my three main indications. The fast moving average ...
Gold techniques, systems, and individual trades
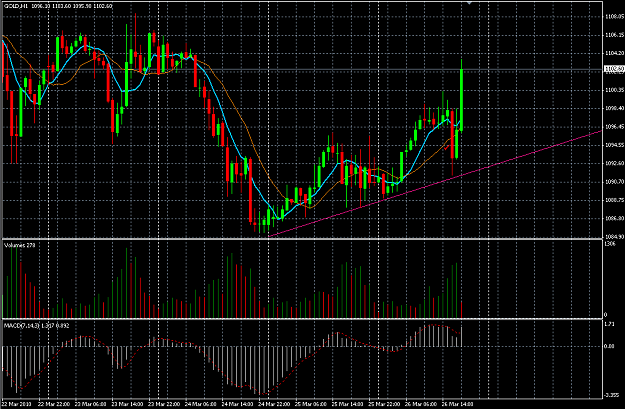
- speedster239 replied Mar 26, 2010
Tremendous bullish spike just occurred without any prior indication. Goes to show how unpredictable the market can be.
Gold techniques, systems, and individual trades
- speedster239 replied Mar 26, 2010
I will enter this trade when the fast moving average begins to move down into the slow moving average. Everything else is explained on the graphic
Gold techniques, systems, and individual trades .
.
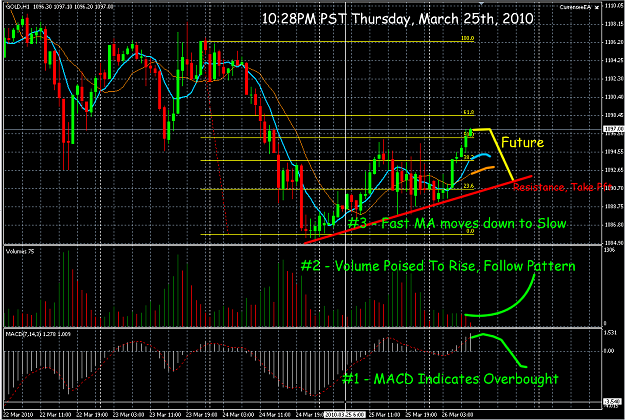
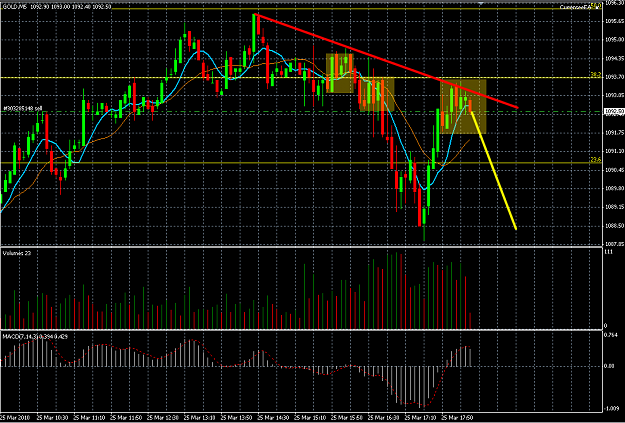
- speedster239 replied Mar 25, 2010
Well, I identified a nice pattern on the 5 minute chart indicating a sell off about to occur. Sold at what looks like the peak. I'm not ever quick to pull the trigger, this looks like a good opportunity. Fast moving average is about to move down ...
Gold techniques, systems, and individual trades
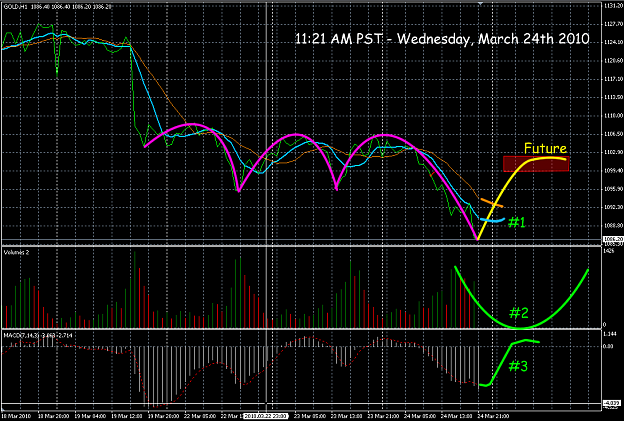
- speedster239 replied Mar 24, 2010
Here's my conviction. I may have painted the rebounding line a bit too high but the idea is that there will be some form of a temporary reversal. A good entrance to the trade would be when the fast moving average (light blue) starts to move up ...
Gold techniques, systems, and individual trades
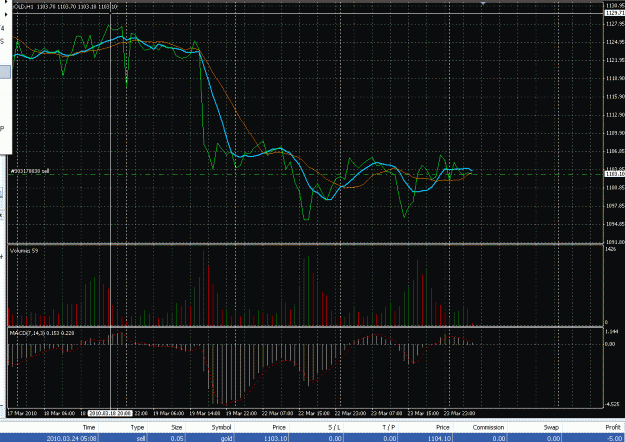
- speedster239 replied Mar 23, 2010
Sold 5 ounces of gold (.05 of a lot) at 1103.10. I will take stop loss if it reaches 1108 sell price and take profit when a trend reversal becomes apparent. All three indications I expected lined up as I posted previously.
Gold techniques, systems, and individual trades

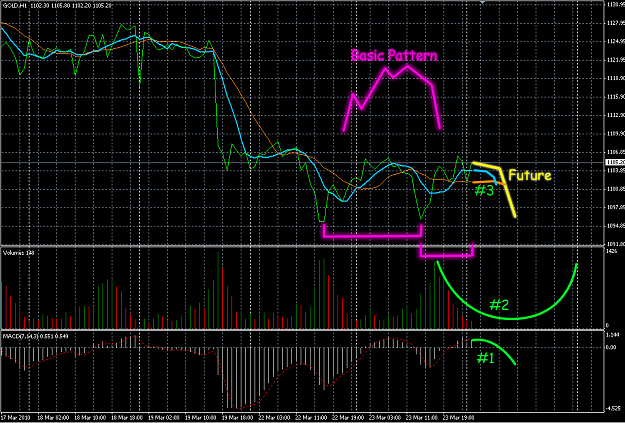
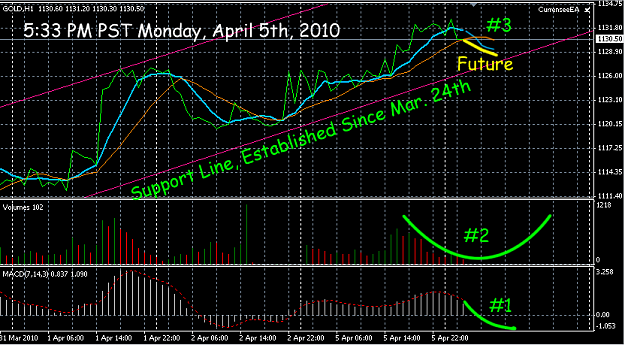
- speedster239 replied Mar 23, 2010
I created a more detailed graphic of my latest trade conviction. Three things will need to line up before I enter the trade. #1 is that the MACD is at about .7 and beginning to drop (indicating a bearish reversal). #2 is that the volume continues ...
Gold techniques, systems, and individual trades