- Search Metals Mine
- 46 Results
- sodiska replied Oct 26, 2013
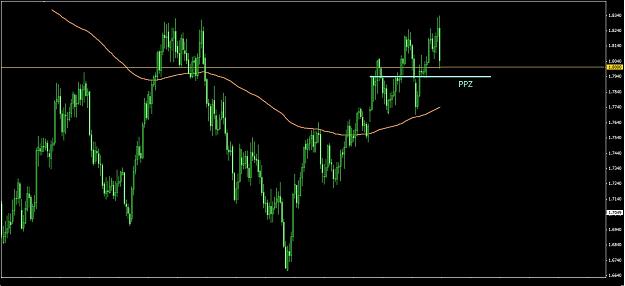
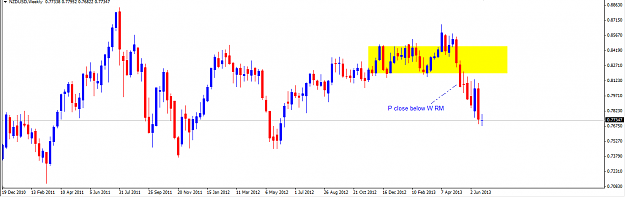
For this 2nd setup: there is a minor PPZ not far below (blue line), I would be cautious and wait for more info. P could bounce off the PPZ and go back up again or close below PPZ and continue to downwards. Just my 2 cents.
james16 Chart Thread
- sodiska replied Oct 26, 2013
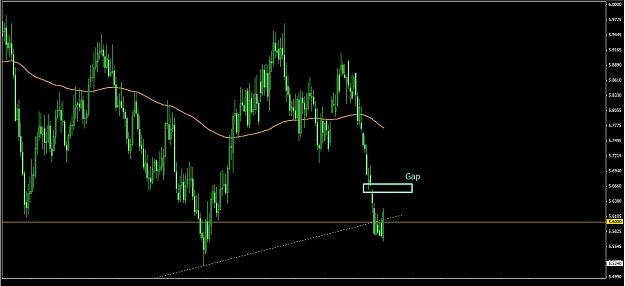
Hi, i will try to chip in on this: There is a gap above (the blue box), with space around, I would buy at the high of the current candle, with SL at the low of the candle.
james16 Chart Thread
- sodiska replied Aug 26, 2013
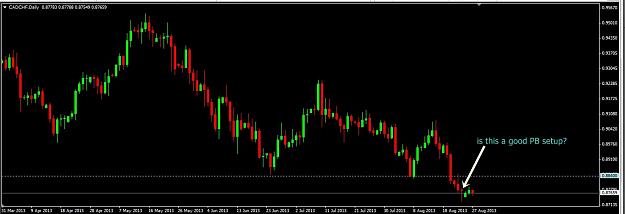
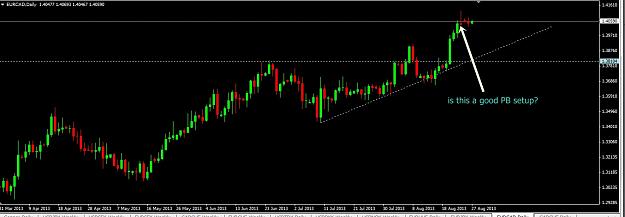
Hi, Hope someone can advice, I notice 2 PinBar setup in both daily CADCHF and EURCAD. Are both good setup?
james16 Chart Thread
- sodiska replied Aug 8, 2013
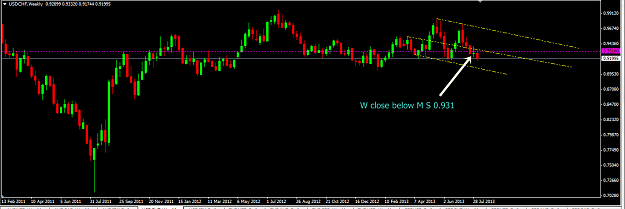
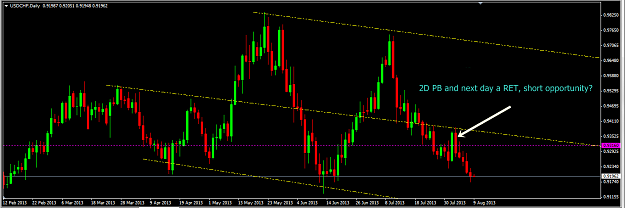
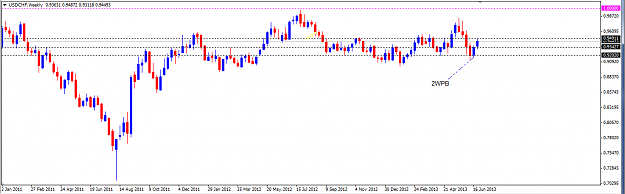
USDCHF, W close below M support at 0.913. 2D PB and a RET, short opportunity?
Beyond the Candles
- sodiska replied Aug 1, 2013
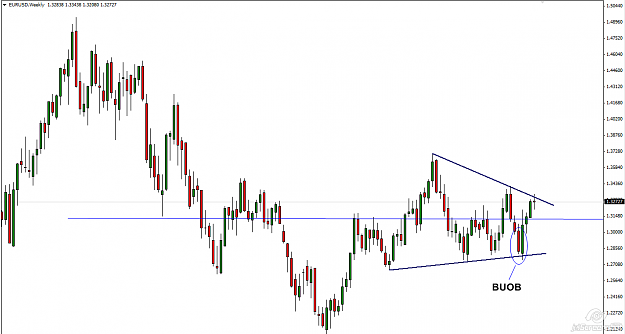
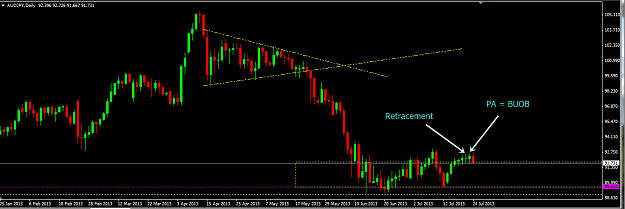
Hi, based on your chart, there is a BUOB which signals long, but there is a R nearby (the blue line). Do we wait for it to close above the R or ?
Beyond the Candles
- sodiska replied Jul 29, 2013
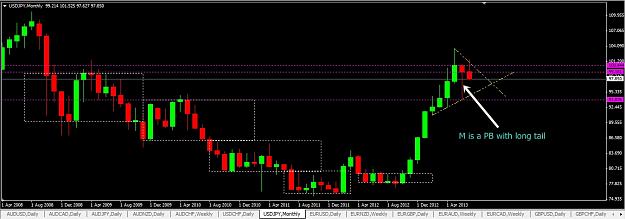
Hi, M is a PB with long tail in a bullish trend, means there are sellers. Am I correct ?
Beyond the Candles
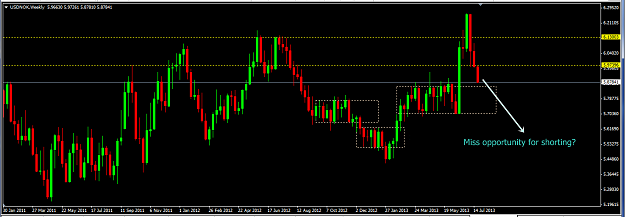
- sodiska replied Jul 28, 2013
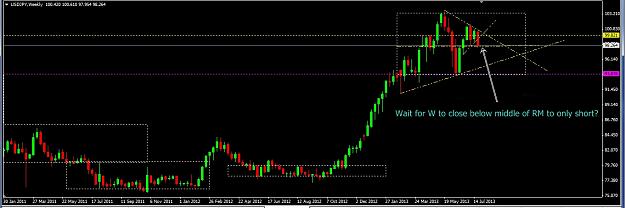
USDJPY, opportunity to short ? Or wait for W to close below middle of RM to confirm ?
Beyond the Candles
- sodiska replied Jul 24, 2013
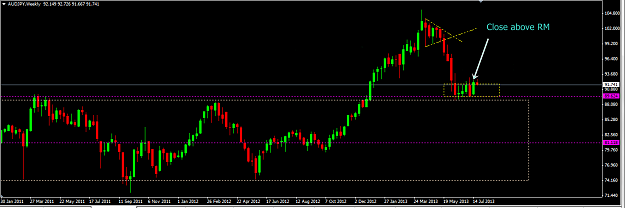
AUDJPY W close above RM, D RET and BUOB. Time to long?
Beyond the Candles
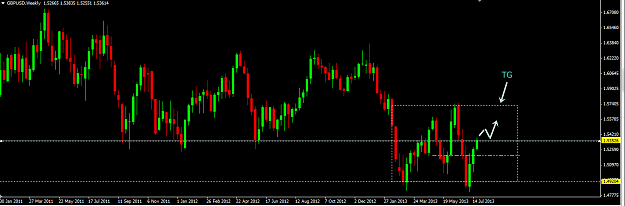
- sodiska replied Jul 22, 2013
Another trade I am looking at: GBPUSD. Waiting for P in W to close above 1.5352 and wait for RET and PA in D to enter long. Still waiting ...
Beyond the Candles
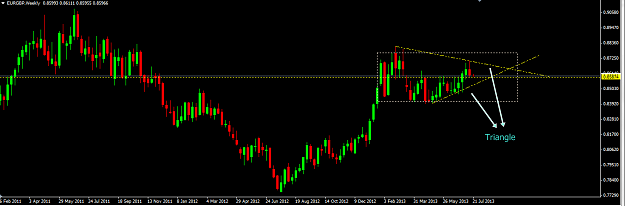
- sodiska replied Jul 22, 2013
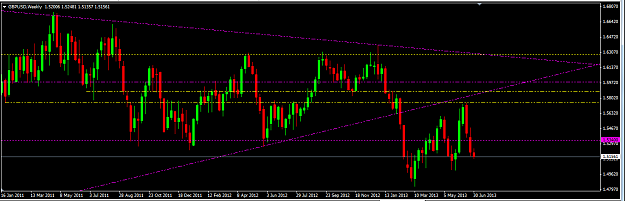
Hi, notice that in the weekly chart, there is a triangle forming.
Beyond the Candles
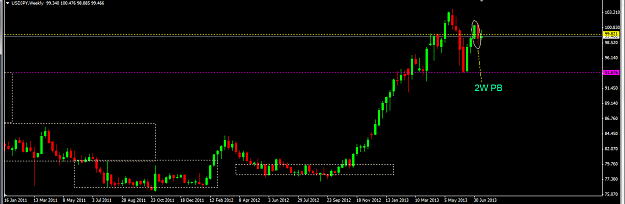
- sodiska replied Jul 17, 2013
Hi, am looking at USDJPY, W formed 2W PB. So now waiting for D RET and PA to enter short.
Beyond the Candles
- sodiska replied Jul 8, 2013
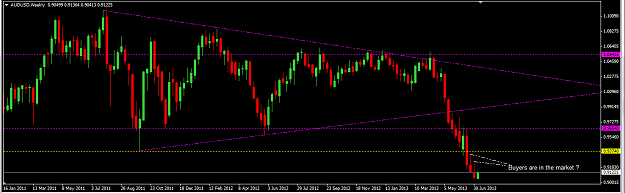
AUDUSD, last 2 weeks, 2 bearish PB with long wicks, does this means buyers are in the market, we should be cautious ?
Beyond the Candles
- sodiska replied Jul 3, 2013
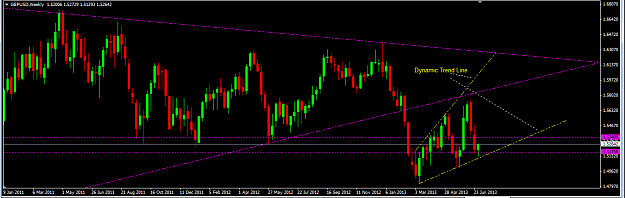
Another thing I notice in W chart is the dynamic TL ...
Beyond the Candles
- sodiska replied Jul 2, 2013
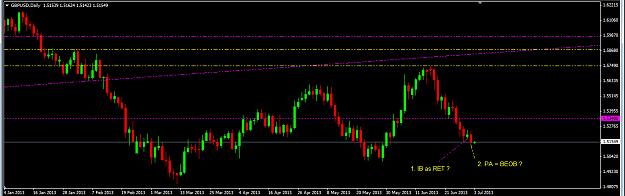
Hi, another trade I m looking at , GBPUSD. W close below S 1.5340. 2 questions I have: 1. Is the IB can be used as RET ? Coz I know IB is a signal for potential reversal. 2. The 2nd candle in D, can it consider as BEOB ?
Beyond the Candles
- sodiska replied Jul 2, 2013
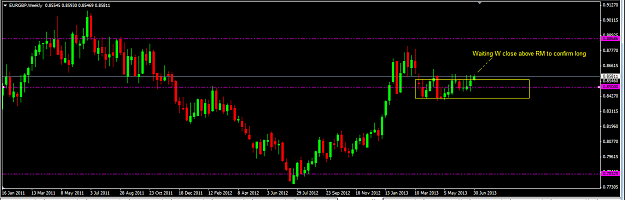
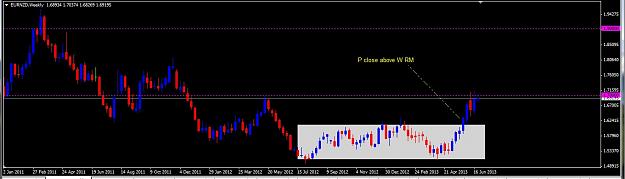
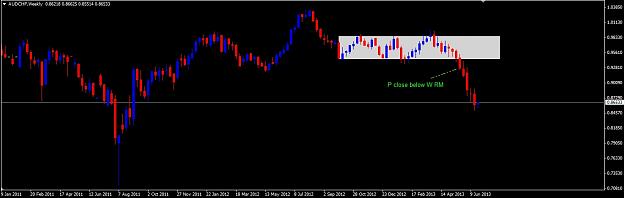
Hi, EURGBP looks interesting. Waiting for W to close above RM to confirm long position.
Beyond the Candles
- sodiska replied Jun 28, 2013
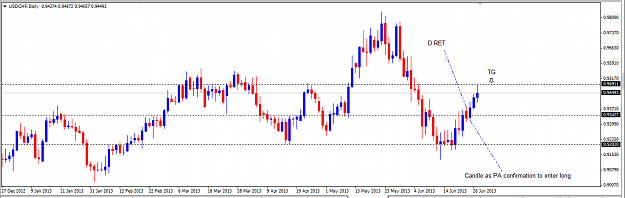
Hi, USDCHF formed 2WPB. D did a RET and a PA with almost BUOB. TG at 0.9491
Beyond the Candles
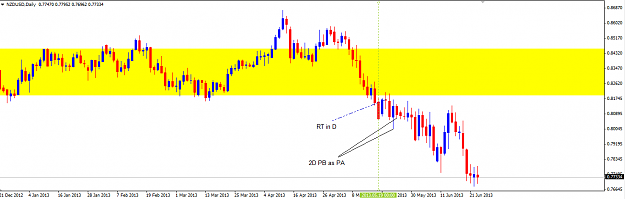
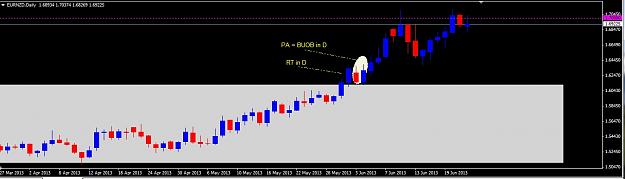
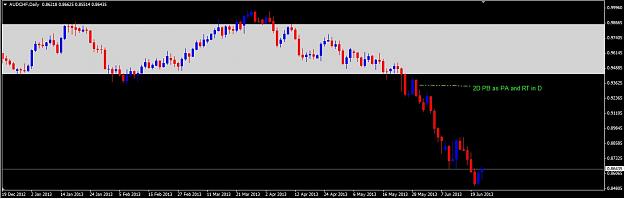
- sodiska replied Jun 24, 2013
Hi FxGroup, attached are charts on PA and RT in D based on W RM observation. Awaiting for your comments. Thanks.
Beyond the Candles
- sodiska replied May 8, 2013
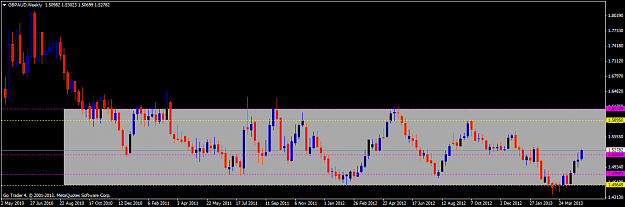
Hi, am looking at GBPAUD, waiting for RT in W at 1.5181 for long confirmation.
Beyond the Candles