- Search Metals Mine
- 63 Results (1 Thread , 62 Replies )
-
 sinqua replied Jun 1, 2020
Trading is long times of doing nothing followed by "woah", so I try to fill up the space by doing 'research' on various ways to skin this cat. I've got 3 different knives: 1. Discretionary 2. Quantitative 3. Brute force, Automated 2 has stalled as ...
(binned per thread starter’s request) Times Two Challenge
- sinqua replied May 20, 2020
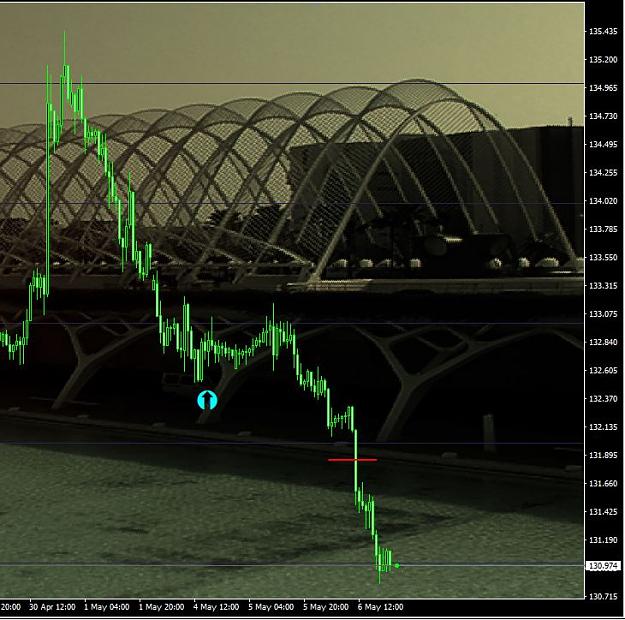
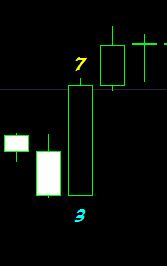
How do I trade? M's and W's before they fully form.
In One Sentence - How Do You Trade?
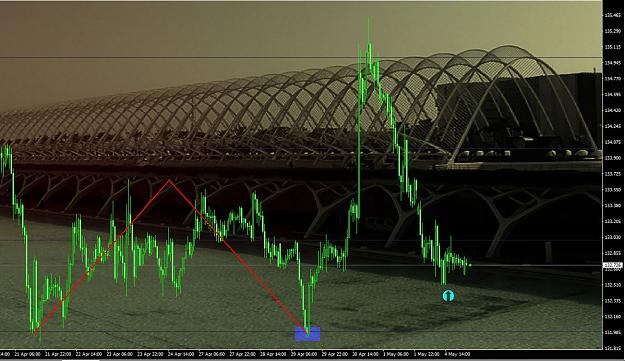
- sinqua replied May 13, 2020
No one can look at this chart and not be seduced into taking that trade, it's impossible, she's too sexy. If I lose I lose.
(binned per thread starter’s request) Times Two Challenge
- sinqua replied May 13, 2020
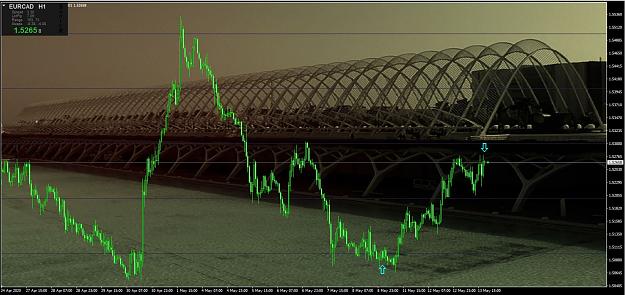
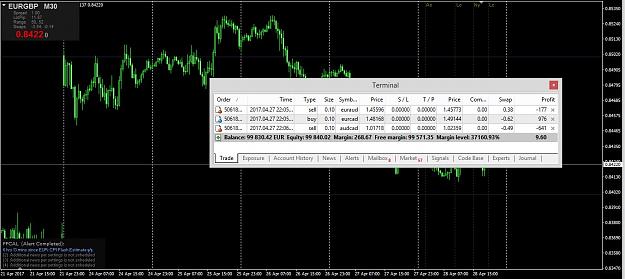
Decided to bite the bullet on the EURCAD. Sell That previous Buy? Went in and got out for 2 pips or so, cos I wanted to sleep, like can you believe. smh.
(binned per thread starter’s request) Times Two Challenge
- sinqua replied May 8, 2020
Re-entered and got out for a little profit. Nice W, couldn't resist. One part says, should've hammered it and waited for the long run, the other part says, take what you can and go, ain't shit promised to you by the market Also took an L on the CHF ...
(binned per thread starter’s request) Times Two Challenge
- sinqua replied May 6, 2020
Decided to re-enter, risk is small...15 or so pips Price has stalled for 4 hrs and its 00 level, so why not. UPDATE: SL got taken out... and then moved as anticipated. Shucks I've always hated SLs
(binned per thread starter’s request) Times Two Challenge
- sinqua replied May 6, 2020
Got out for a loss, meh. Lesson: If the trade is wasting time, get out. Put some respect on the 00 levels name??
(binned per thread starter’s request) Times Two Challenge
- sinqua replied May 4, 2020
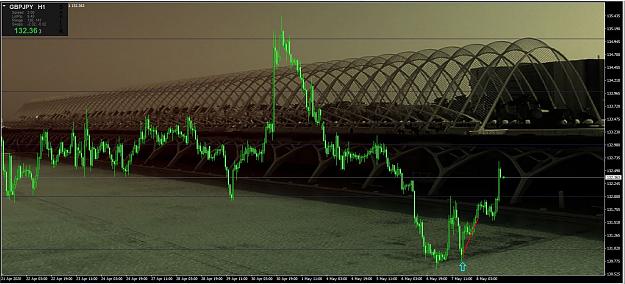
Bored, lots of free time, so here I post again. I won't be replying anyone here, in keeping with a journal style. GBPJPY: Missed the W move on the 29th as I was trying to prove a point on the EURGBP, entered expecting a pull-back not my style but ...
(binned per thread starter’s request) Times Two Challenge
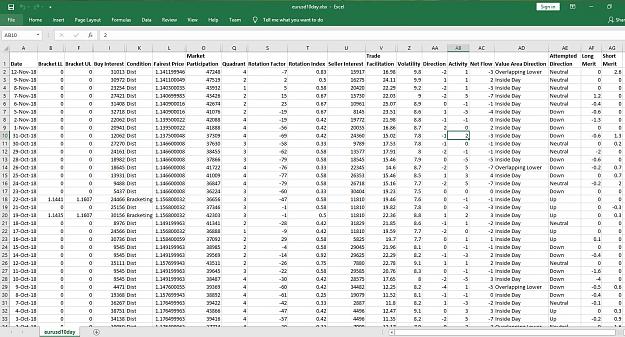
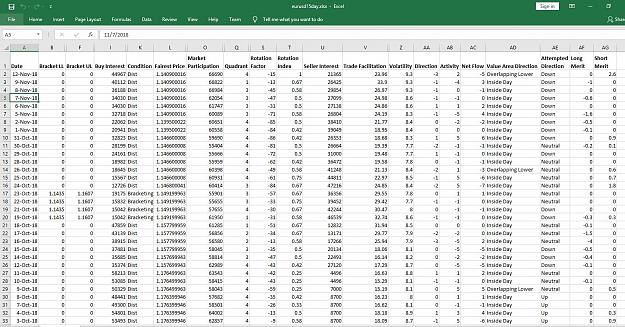
- sinqua replied Nov 18, 2018
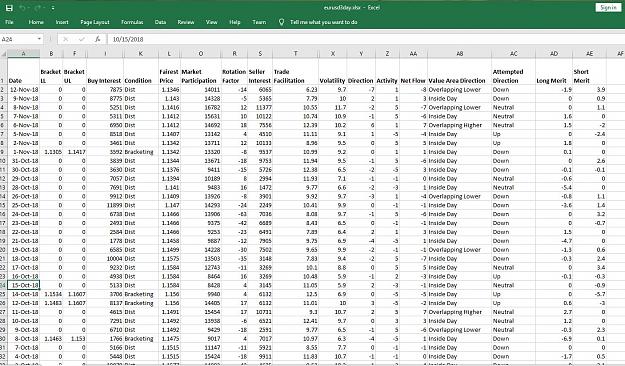
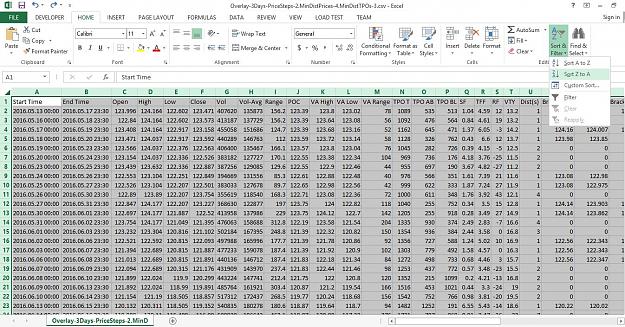
Thanks for the updates. Hello All. Attached are my analysis sheets up to the 12th, I'm calculating without the indicator using tick data gotten from [fxcm and TrueFX] [still working on my code] hence the delay. Per the attachments. Opportunity for a ...
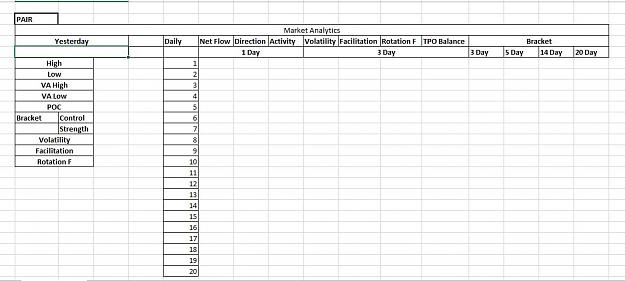
Auction Market Value Theory & Analytics
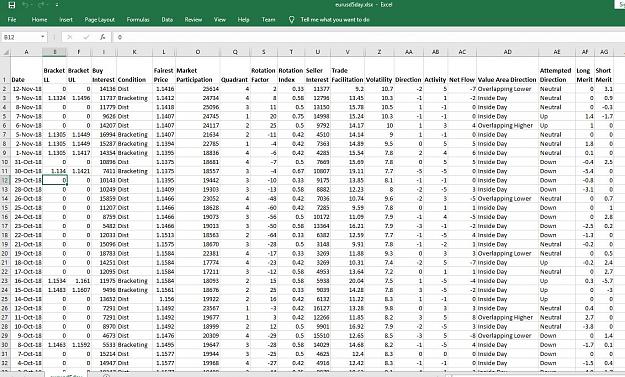
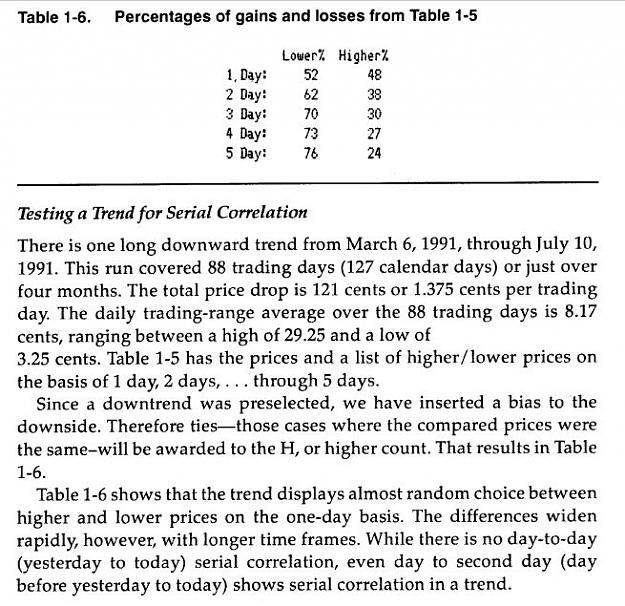
- sinqua replied Sep 25, 2018
Through an Overlay Demand Curve Using reference points, beginning with the fairest price i.e POC Markets lack day to day serial correlation, the experiment in VBPT pg. 21 Table 1-5 showed a minimum of 3 days is required for correlation
Auction Market Value Theory & Analytics
- sinqua replied May 21, 2017
I have two questions. 1. What machinery/component is that? I mean the whole thing in the picture. 2. Do you have a maximum lot-size limit? Now you're going to have me asking myself "What do pilot operated safety release valves have to do with ...
(binned per thread starter's request) The Monty Hall Problem appl

- sinqua replied May 13, 2017
Talking about patterns this one has been like the sunrise for a good while...we can have fun observing how long it lasts. If one could find a temporary edge (of say 5 - 15 yrs lifespan) one could retire rich.The market was here before us & it'd be ...
5 years and still no strategy
- sinqua replied Apr 28, 2017
Practical observation of his suggestion has proven that it is indeed possible to profit, the frequency of its occurrence you'd need to examine yourself as well as spread and swap costs. You should also notice that I did the opposite of his ...
Hedging - Strategies
- sinqua replied Sep 3, 2016
Err I hope this solves your issue. See pic
Auction Market Value Theory & Analytics
- sinqua replied Aug 31, 2016
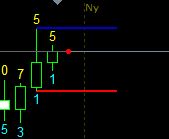
The Indicator works as explained A few requests. Could you make it such that it shows resistance and support lines at specified "power" levels Example: @ any where theres a 5 and 1 (specified in indicator properties) it will draw lines (specified ...
Basket Robots
- sinqua replied Aug 24, 2016
I couldn't verify the accuracy for GBP but for JPY those marked X are definitely off, may be more P.S: I watched the calculation go off even on the current candle
Basket Robots
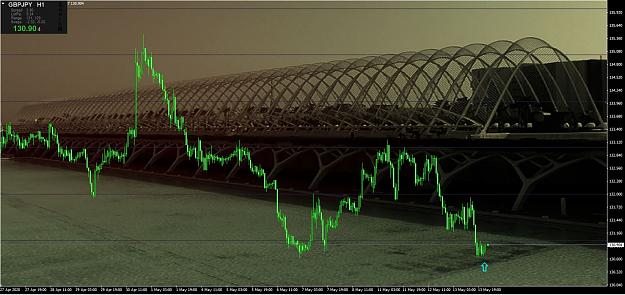
- sinqua replied Aug 24, 2016
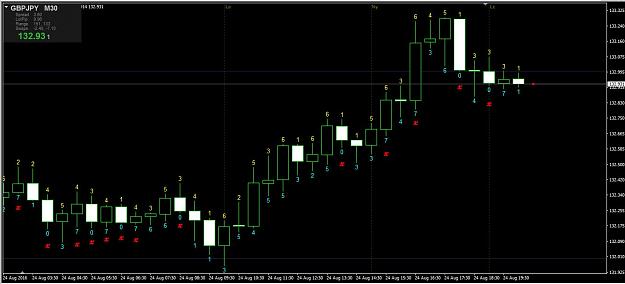
Err I think there is an error in the calculation. In the picture below [a GBPJPY chart]: JPY finished at 7: This should mean it was a bear bar in ALL 7 of the currency pairs (which isn't possible as the GBPJPY candle was UP) I should explain with a ...
Basket Robots

- sinqua replied Aug 23, 2016
Hello abokwaik. I hope you find this worth your time. I'm studying the major 8 pairs, and looking at ways to measure each currency's strength, this seems very similar to what is done here using the baskets. My idea is this: Each pair is measured ...
Basket Robots
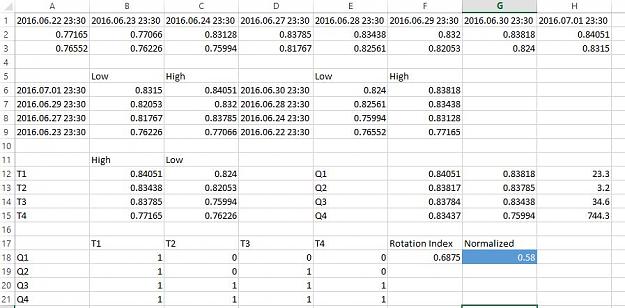
- sinqua replied Aug 2, 2016
Would someone have a look at this calculation of 8 Day Rotation Index and tell me if it is correct. The pdf that explains its meaning and derivation is a bit confusing for me (mainly the "Q" part).
Auction Market Value Theory & Analytics
- sinqua replied Jul 28, 2016
My questions are more directed towards working with the software required for data manipulation. I'm finding the concept difficult to grasp. So I see that 3 Software's I usually used. a Spread sheet app, a Programming app, and a Database app. ...
Auction Market Value Theory & Analytics