- Search Metals Mine
- 20 Results
-
 simon.says replied Mar 21, 2024
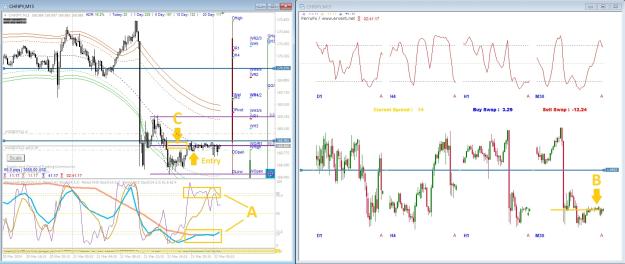
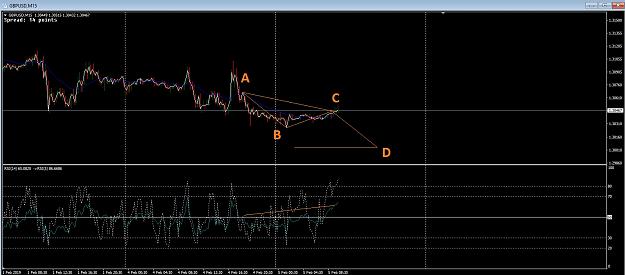
Hi ghbdr, What do you think about this ongoing trade? Reasons for entry were: image A: Elasticity between 4h1h & 15min B: Price Action Wicks C: Fib Level 50% Simon
D1 Elasticity Pullback Trading
- simon.says replied Mar 19, 2024
Hi ghbdr, I'm glad to see that you are reviving this thread. I have spent the last couple of weeks following and revisiting your and Spudfyre's posts, trying to understand your decision-making process. At this point, some things are clearer than ...
D1 Elasticity Pullback Trading
- simon.says replied Oct 23, 2019
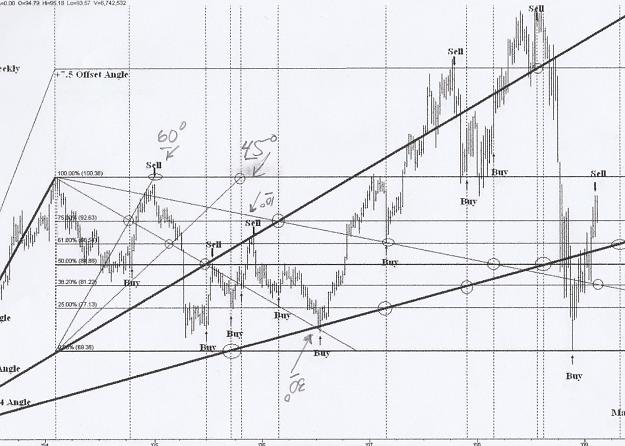
Hi everyone, In an earlier post the picture below was used to demonstrate how one could forecast turning points. Now, I understand how the angles (Jenkins Secret Angle Method) and the support and resistance levels were created. What I have a problem ...
Time and Price Forecasting
- simon.says replied Jun 19, 2019
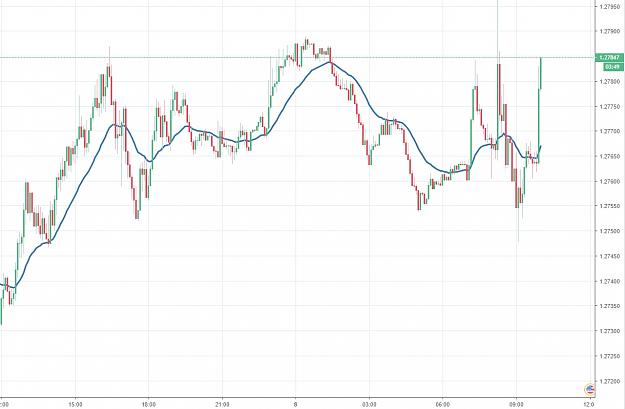
So it was easy to see on the bright chart that we had some distance up to the next MA pivot. What to me is still unclear is how to trade a situation with conflicting 1H signals. On the way up to the next level, there were numerous H1 inferences with ...
Trading the Cable swings via averages
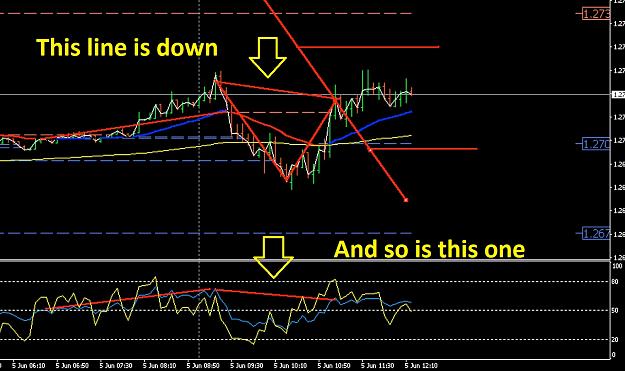
- simon.says replied Jun 5, 2019
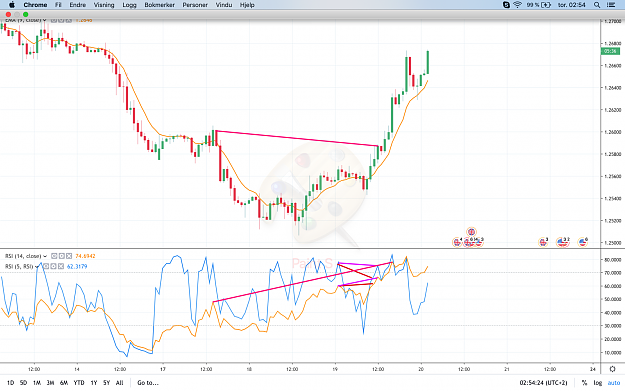
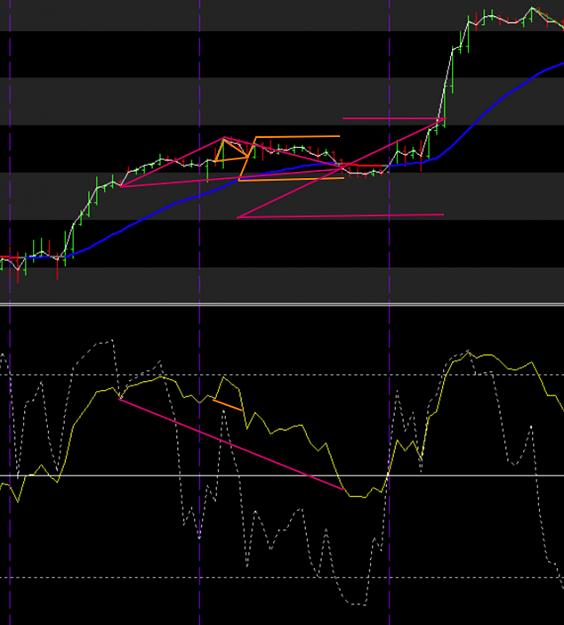
Because the line on the chart is now pointing in the same direction as your slow RSI line, it is no longer a valid ABCD.
Trading the Cable swings via averages
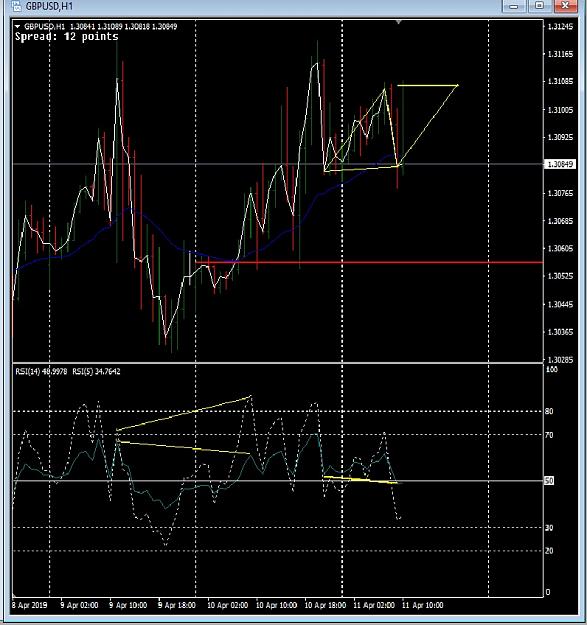
- simon.says replied Apr 11, 2019
Sorry guys, I was a little bit too quick. The pivot under attack was the prior one which finished right after London open.
Trading the Cable swings via averages
- simon.says replied Feb 26, 2019
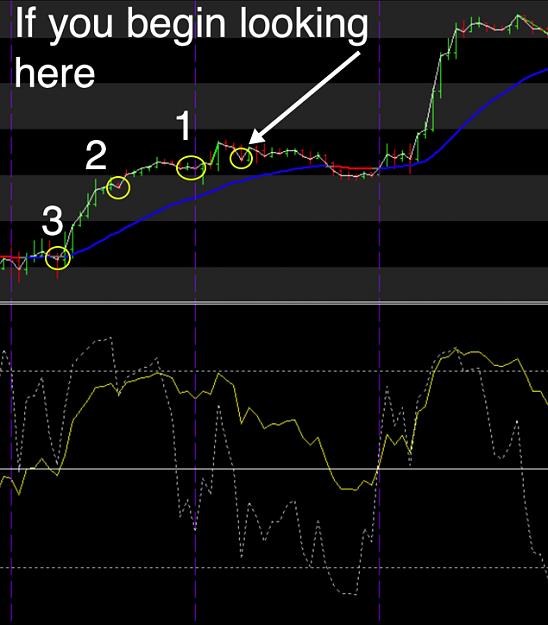
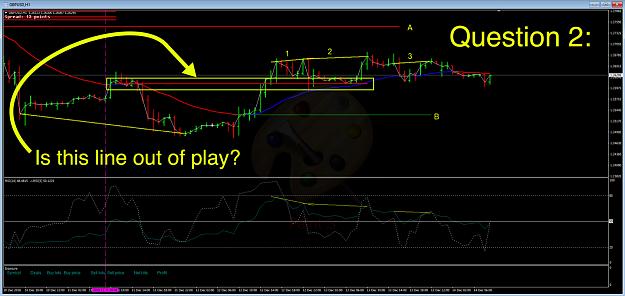
Hey, I will try to give you an answer. In the attached photo I have marked three different pivots. When you are drawing your ABC triangles you have to make sure that you are not jumping over one to make the line "fit". So using the photo as an ...
Trading the Cable swings via averages
- simon.says replied Feb 13, 2019
Hey guys, So one of the issues I often run into is picking the “wrong” divergence. I am sure many of you know the feeling of following the signals and take on positions either short or long as the divergence is signinaling, only to see that price ...
Trading the Cable swings via averages
- simon.says replied Feb 5, 2019
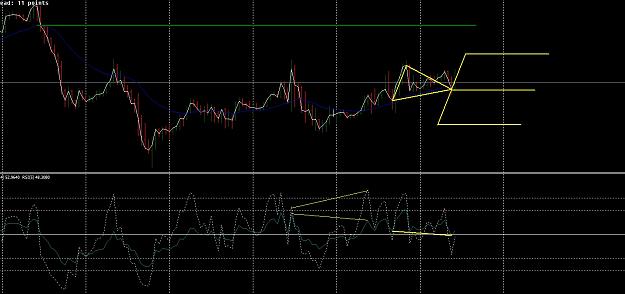
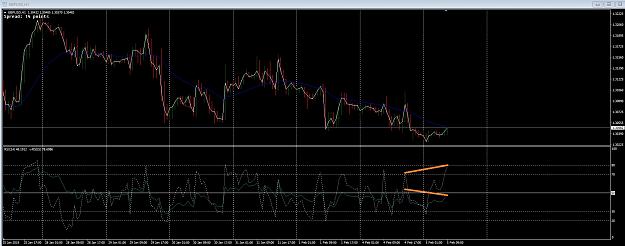
Anyone reading this as a 1H inference?
Trading the Cable swings via averages
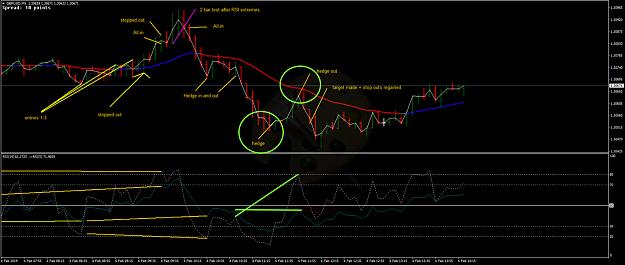
- simon.says replied Feb 4, 2019
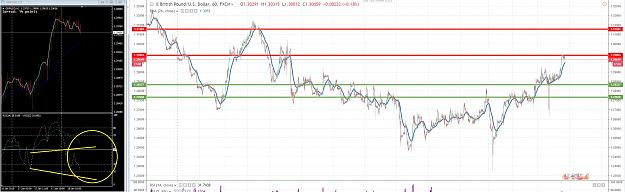
Hi David, I would like to know why you hedged(out) the two encircled areas. Is it correct that the Hedge had to do with the low RSI and the HedgeOut was taken because it hit the EMA?
Trading the Cable swings via averages
- simon.says replied Jan 18, 2019
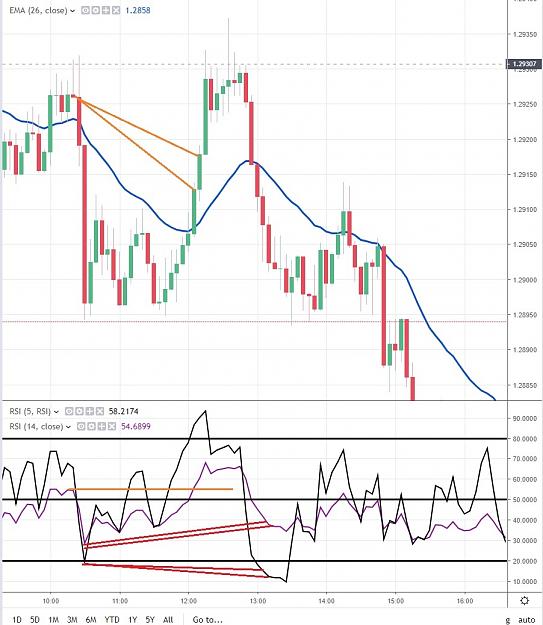
Morning folks Looks like we are about to get an H1 divergence. I wouldn't be suprised if the bears keep pushing back to MA26 before we get our higher timeframe inference where the bulls will take control. As Mike mentioned, if MA breaks 1.29894, we ...
Trading the Cable swings via averages
- simon.says replied Jan 9, 2019
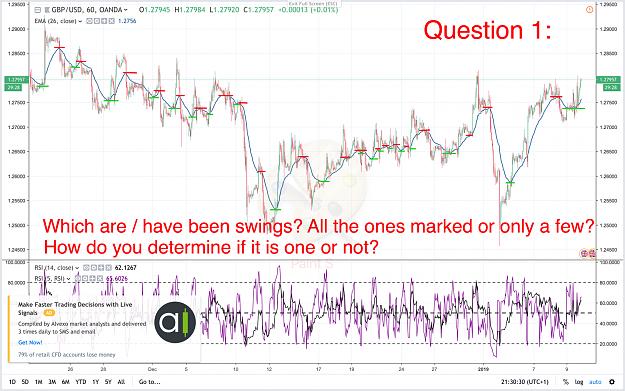
Hi Alan, I got two questions about target lines: 1) How do you draw your swings highs / lows? I am aware that you do so using the Moving Average, but what I have a problem with is to determine which tops and bottoms are valid. For example, in the ...
Trading the Cable swings via averages
- simon.says replied Jan 8, 2019
Oh well, glad I didn't enter....
Trading the Cable swings via averages
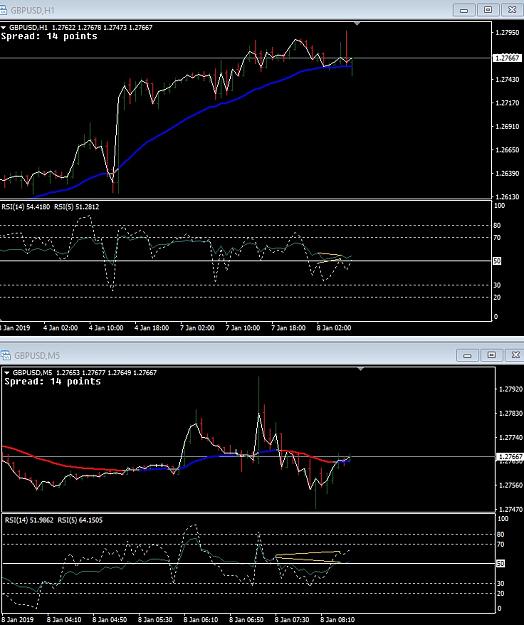
- simon.says replied Jan 8, 2019
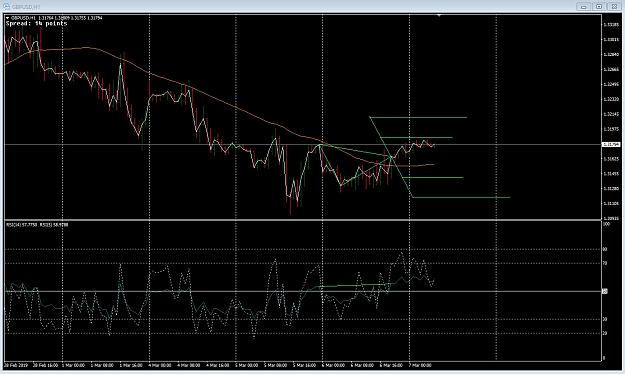
Anyone going short? As far as I can tell it looks like we got Alan's divergence on H1 and M5 pointing south.
Trading the Cable swings via averages
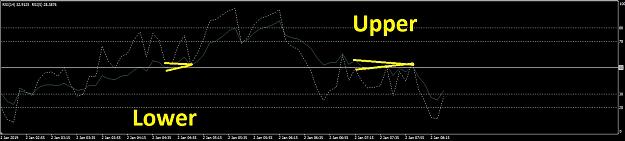
- simon.says replied Jan 2, 2019
One last question about divergence: Does the side the signal is on determine whether one should go long or short? So for instance in the attached photo we got Alan's divergence on both the Lower and Upper side of the RSI. Let's say we have ...
Trading the Cable swings via averages
- simon.says replied Jan 2, 2019
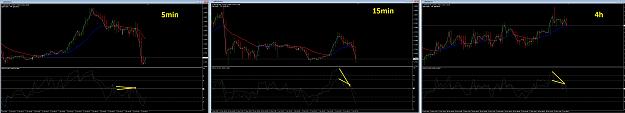
Hi Bydyke and thank you for sharing your insights. Looks like you were right about the direction price were heading. Anyhow, I drew a few lines on the M5,M15 and H4 charts. Do you mind commenting if these were the same lines you used to get ...
Trading the Cable swings via averages
- Posts by Member Search: 'simon.says'