- Search Metals Mine
- 82 Results
-
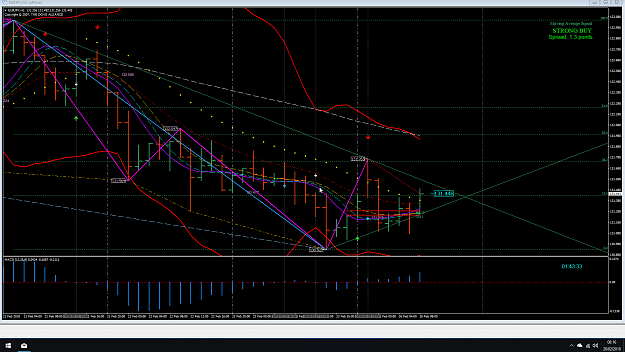
 shinny replied Feb 26, 2018
Hello Traders Well over the weekend forex.com have scrapped the old UK servers. I was using Live 6, and that now is turned off for good. I am now on live 114 server. Here is my chart from this morning on EJ 2hr: image The last time I tried the new ...
The Paradox System
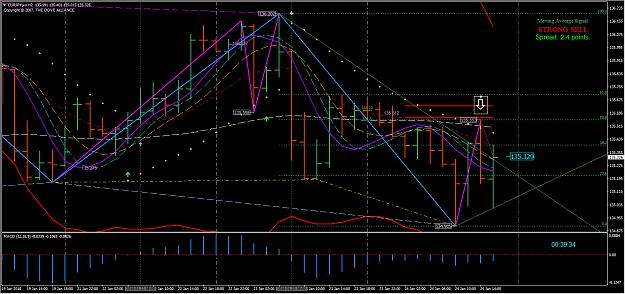
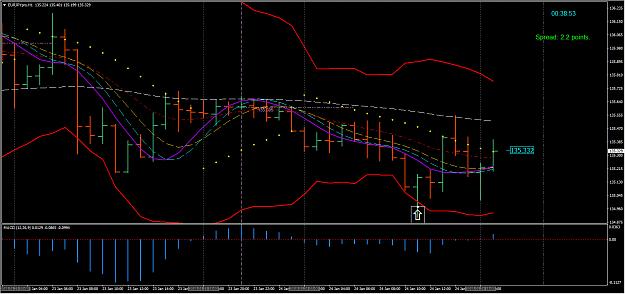
- shinny replied Jan 24, 2018
Hello Traders Sorry I have been quiet recently, been very busy trading (saving up for a new house) and family! Here is my trade from today, a very quick EJ sell: 2hr: image I sold the touch of 2hr ROMAR. A very straightforward trade I believe. ...
The Paradox System

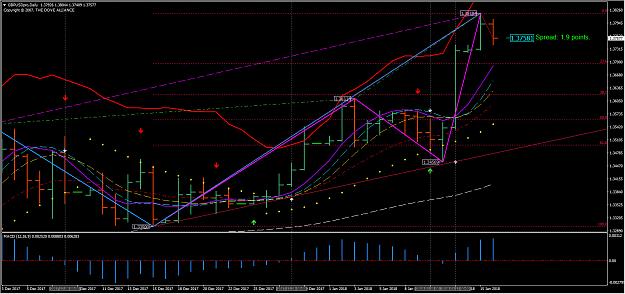
- shinny replied Jan 16, 2018
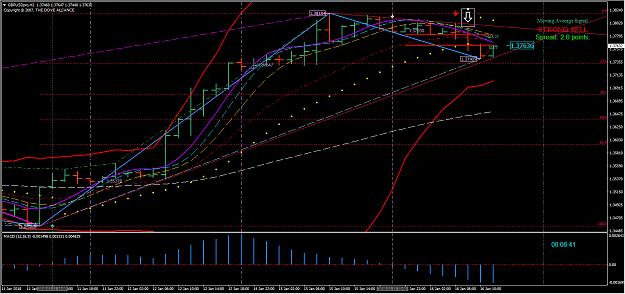
Hello Traders Here is my trade for today: GBP Daily: image Daily Chart shows the market Out Of Balance with Purple, at the Open by about 100 pips, and this is the 2nd day. 2hr: image 2hr shows the entry at the open of the bar with the arrow. I ...
The Paradox System

- shinny replied Jan 12, 2018
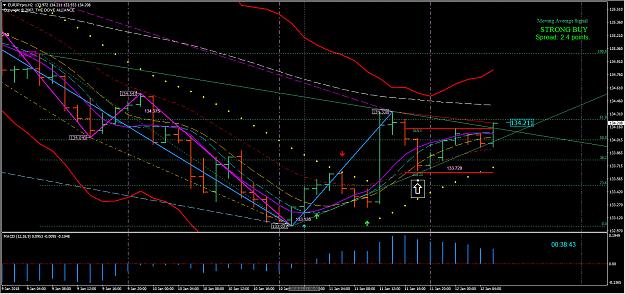
Good Morning Traders Here is the trade I took last night when I got home and sorted out my home office MT4!! 2hr Chart: image The entry was halfway through the bar with the arrow. The fib has moved now but the entry was at the 23.6% fib, and was ...
The Paradox System

- shinny replied Jan 10, 2018
Perfect entries. Took my entry at Smooth on the last bar. image Thanks! Shaun
The Paradox System

- shinny replied Dec 19, 2017
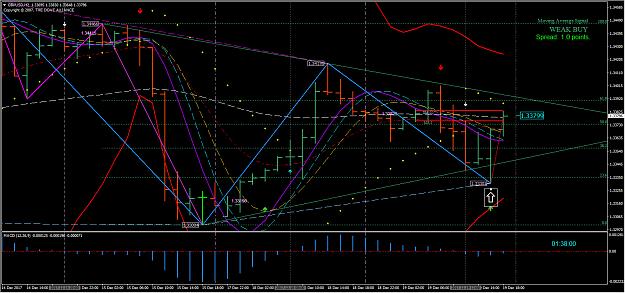
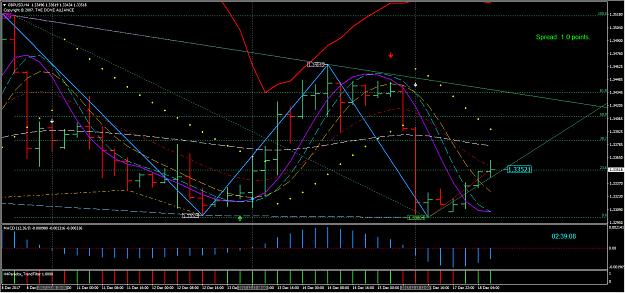
Hello Traders Here is my +40 for today: 2hr Chart: image My entry was during the bar around the 23.6 FIBO. Daily chart is in Consolidation with ROMAR as Support and PSAR (eliminated on todays close) and EMA as Resistance. Market has been trading ...
The Paradox System

- shinny replied Dec 18, 2017
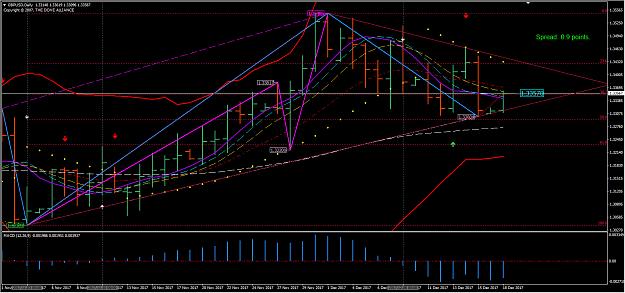
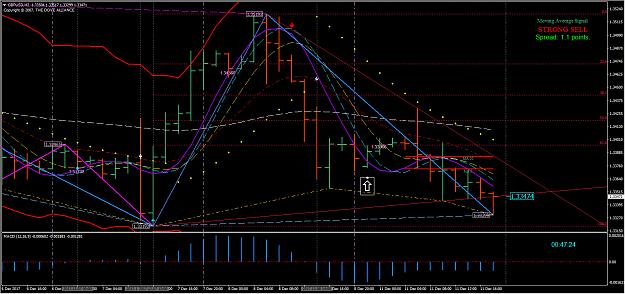
Good Morning Traders Here is my +40 for today: Daily: image Daily chart showing ROMAR Support, EMA and PSAR as Resistance and the FIB down with DB/SAR on the bottom. Market in Consolidated downtrend heading to ROMAR support. 4hr: image 4hr Chart ...
The Paradox System

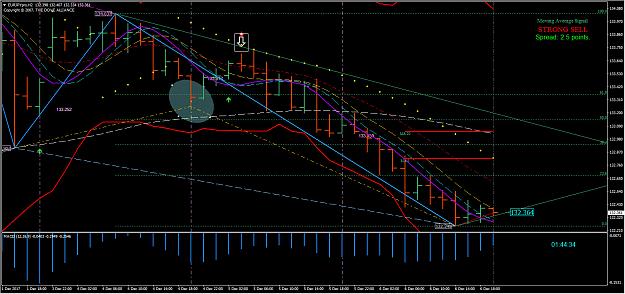
- shinny replied Dec 11, 2017
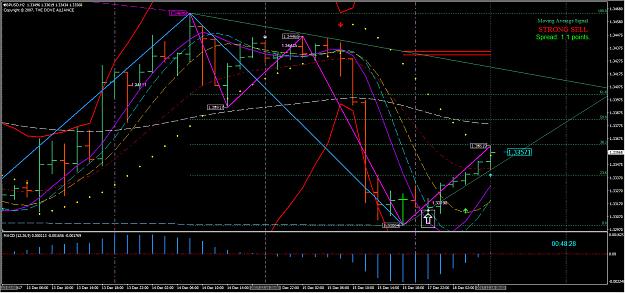
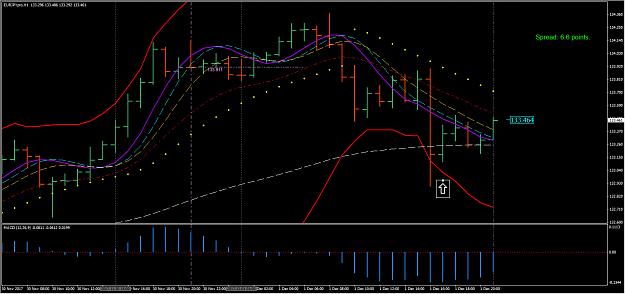
Hello Traders Here is my trade from today: 2hr: image I bought the market at the open, with space for 40 pips to Resistance. Daily chart is turning over with PSAR flipping on this Daily bar. Market is in Consolidation so trading is from bottom up ...
The Paradox System

- shinny replied Dec 6, 2017
Hi Pipon Here is the chart you posted: image Ok, what do you see on the bottom with the DB/SAR? The Light Sky Blue. You know that the market will get below that low and trigger the Gold Hidden Divergence, so just making sure you had +40 to that ...
The Paradox System
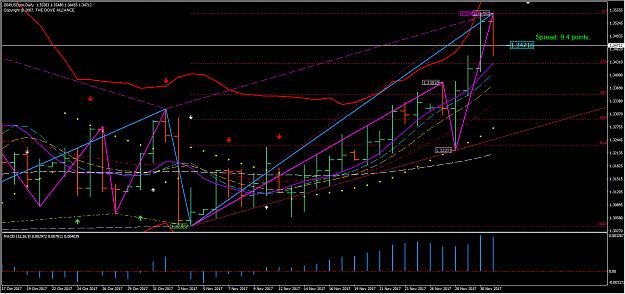
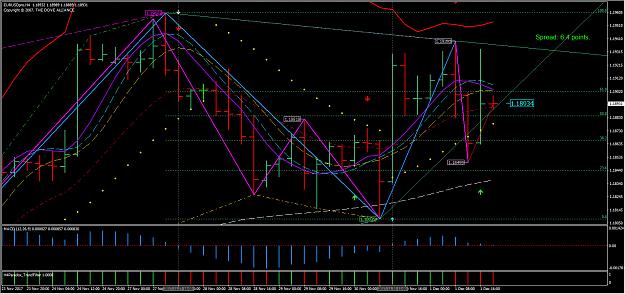
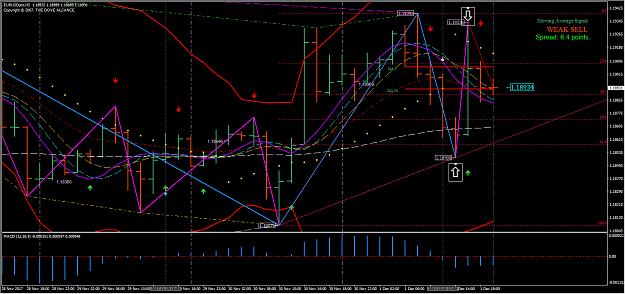
- shinny replied Dec 2, 2017
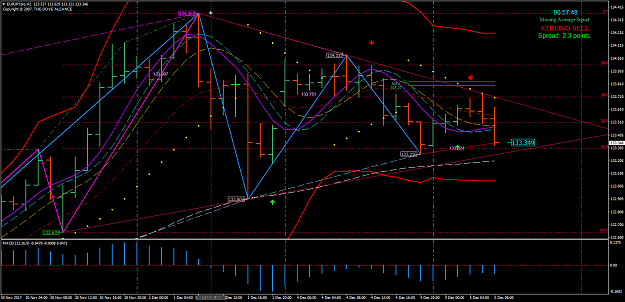
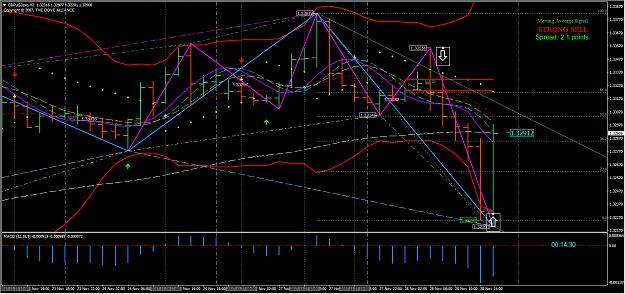
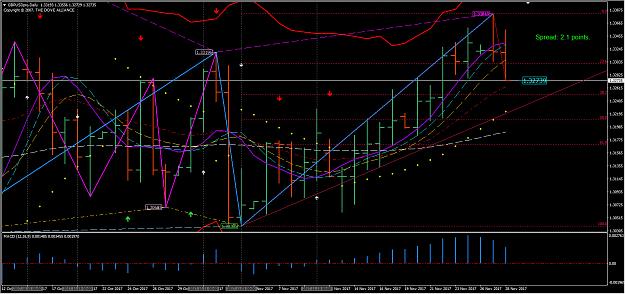
Hello Traders I hope you are enjoying your weekend. I just thought I would do a quick post before I go out, just showing what I got up to yesterday in the market. Here is the GBP situation: Daily: image Daily Open shows market 100 pips out of ...
The Paradox System
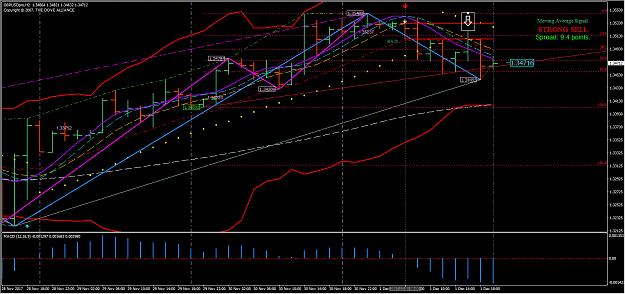

- shinny replied Nov 28, 2017
Hello Traders (again) I am not working tomorrow most likely as we are Christmas shopping so I took another trade, which just shot up because the UK/EU have agreed the divorce bill. 2hr: image 2hr shows the market close outside the BB. This also ...
The Paradox System

- shinny replied Nov 28, 2017
Hello Traders Here is my +40 for today. Daily: image Here is the Daily showing the Uptrend. The fib on all charts have flipped to Red, and remember the Rule about EMA and ROMAR crossing? Here is the 4hr: image 4hr chart showing the PSAR flipped ...
The Paradox System

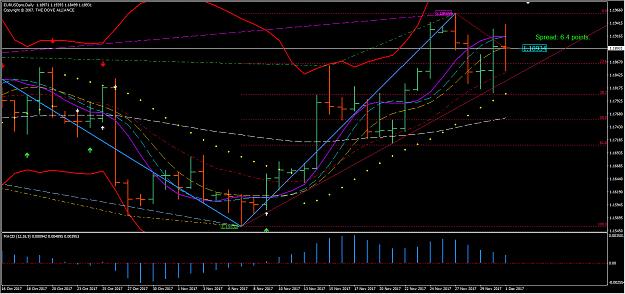
- shinny replied Nov 27, 2017
Hello Traders I hope you had a good weekend. Here is my +40 from today: Daily: image Daily chart showing uptrend. Market opened at White. 2hr: image 2hr Chart showing the entry just after the SAR on the bottom. 1hr: image Here is the 1hr chart ...
The Paradox System

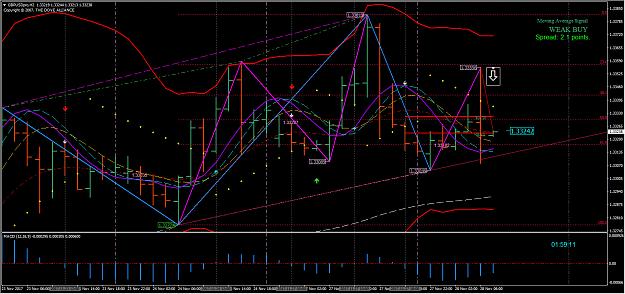
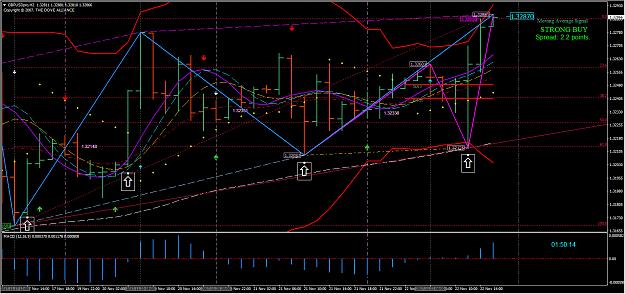
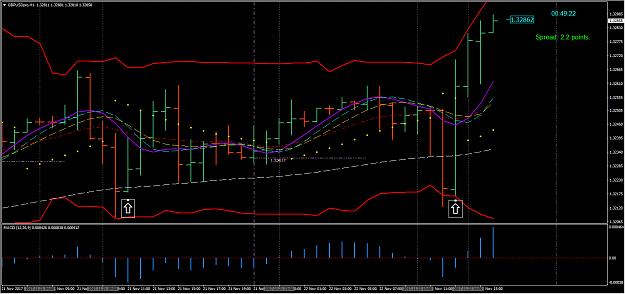
- shinny replied Nov 22, 2017
Hello Traders Here is my +40 for today: 2hr Chart: image The 2hr chart has been a little tight today and yesterday. The Daily is in a strong uptrend, with 2hr and 4hr fibs down. I have been keeping my eyes out for a pullback to Daily ROMAR as per ...
The Paradox System

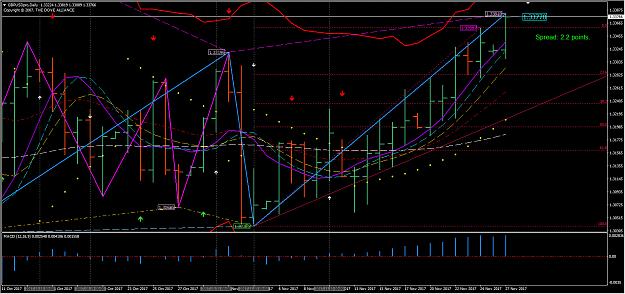
- shinny replied Nov 20, 2017
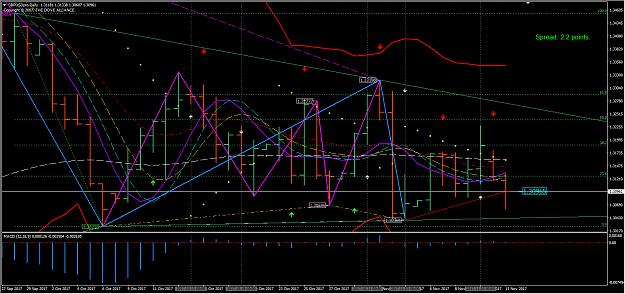
Good Morning Traders Here is my trade from today, and also Friday: Daily Chart: image Daily showing ROMAR, EMA and PSAR as Support with EMA/ROMAR just crossed. Fibo Red. 4hr Chart: image 4hr Chart showing the move up and the DB/SAR separate at ...
The Paradox System

- shinny replied Nov 16, 2017
Hello Traders Here is my +40 for the day. 4hr Chart: image Here is the 4hr chart showing the entry at the open of the bar with the arrow. I was waiting for this set up from yesterday after the divergence showed up. I was waiting on the SAR to ...
The Paradox System

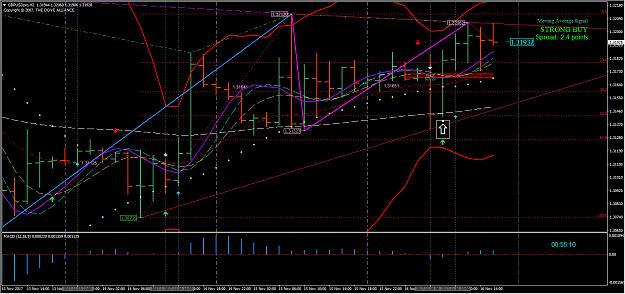

- shinny replied Nov 15, 2017
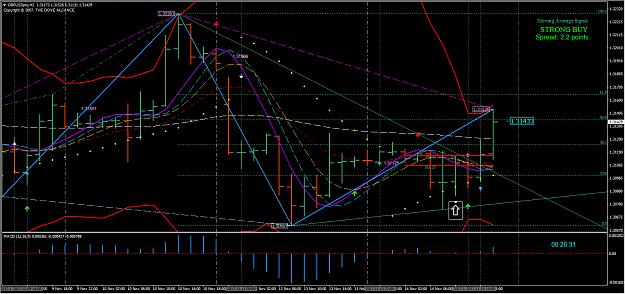
Hello Traders Here is my trade(s) for the day. Remember, I am trading GBP: Daily Chart: image The Daily is showing PSAR as Support with EMA/Purple crossing/ed. 4hr: image 4hr Chart showing EMA/ROMAR 15 pips apart, set to cross with the DB/SAR ...
The Paradox System

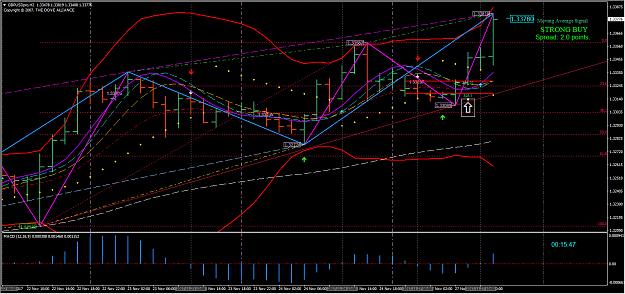
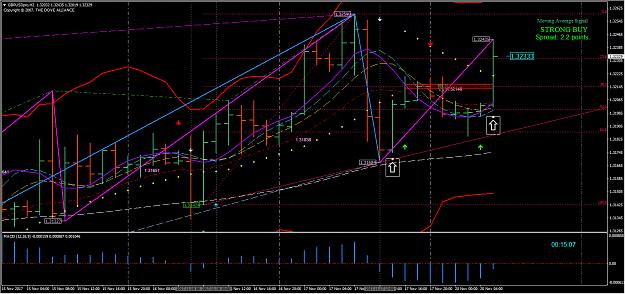
- shinny replied Nov 14, 2017
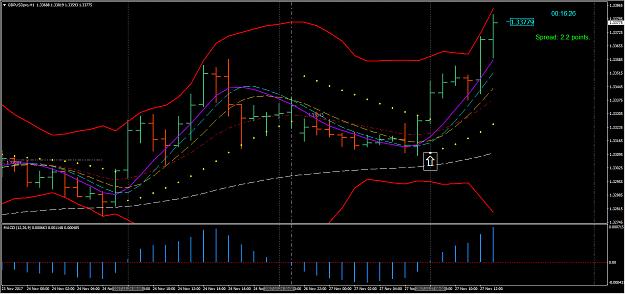
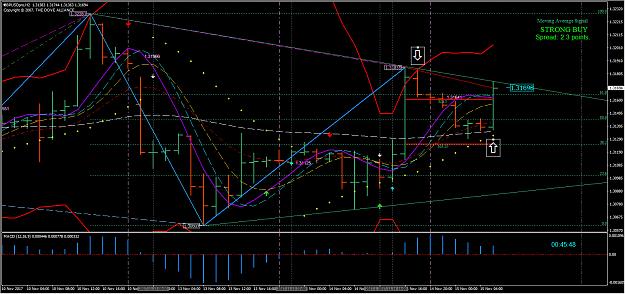
Hello Traders Here is my +40 for today. Daily Chart: image Daily is showing the PSAR flipped and the fibo for the up. Any long trade would need to be mindful of ROMAR and EMA Resistance above. 2 Hour Chart: image 2hr shows the entry, with 37 ...
The Paradox System

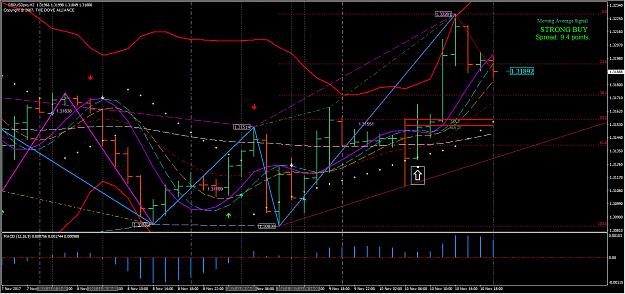
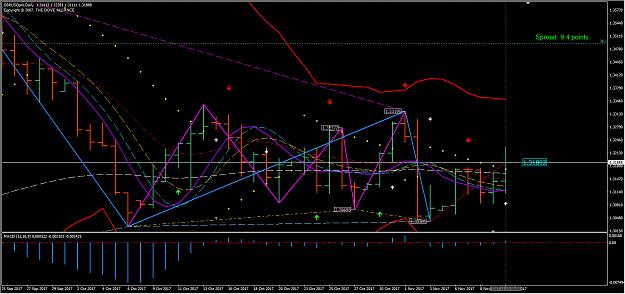
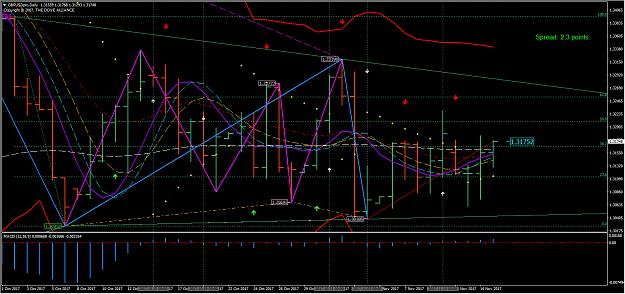
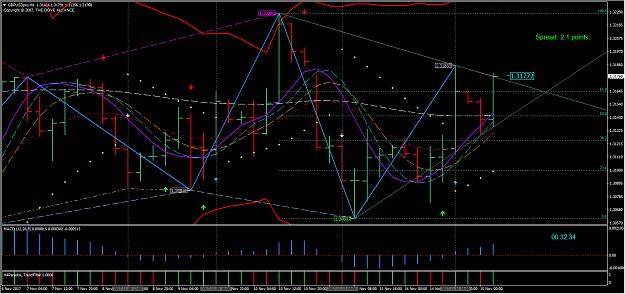
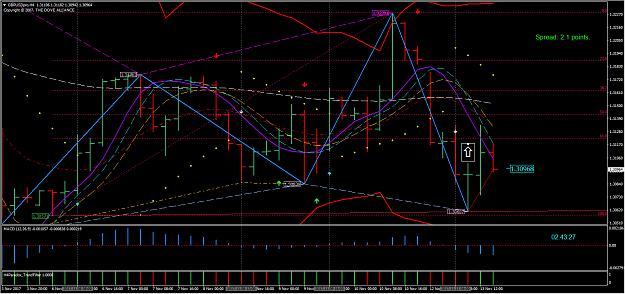
- shinny replied Nov 13, 2017
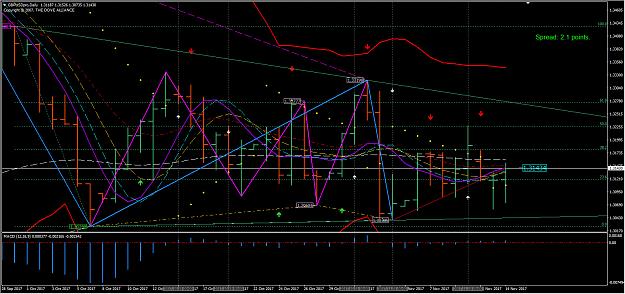
Hello Traders Here is my +40 for the day. Daily Chart: image Daily chart showing ROMAR & EMA as Resistance, with market still in a 136 pip range (apart from the break out on Friday). The market is in Consolidation Ranging. Here is 4 Hour Chart: ...
The Paradox System

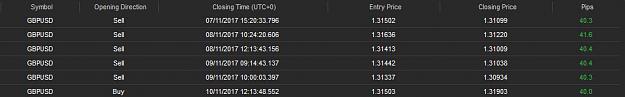
- shinny replied Nov 11, 2017
Hello Traders I got home yesterday from my office and we had no internet. Thankfully, BT have been and fixed the outside pole today, so I am back online. I just wanted to post my results for last week, I did an extra trade so 6 instead of 5 and each ...
The Paradox System