- Search Metals Mine
- 35 Results
-
 shaheer9856 replied Jan 3, 2018
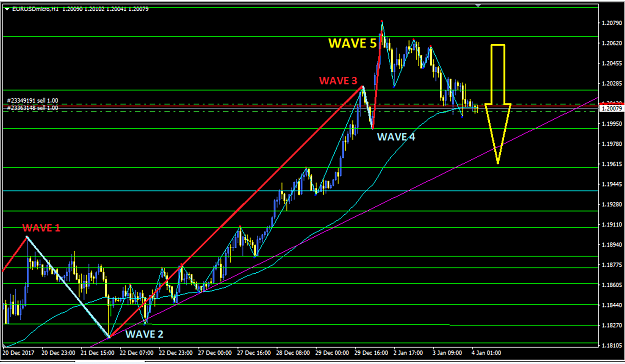
I think that it has completed 5 wave pattern and now its time for correction. Unable to break 1.20675 resistance, price is now moving slowly under 65 EMA, 5 wave pattern is complete, overbought RSI in H4 is now recovered.....everything looks in the ...
EURUSD only
- shaheer9856 replied Jan 3, 2018
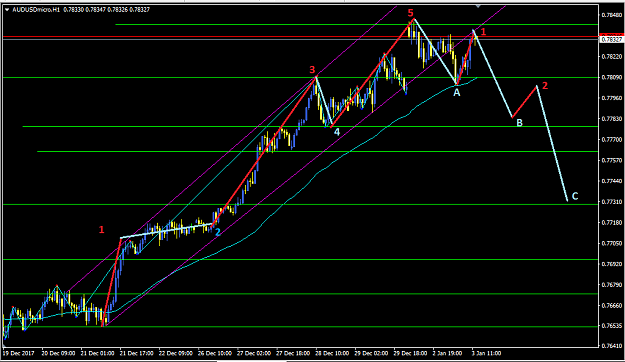
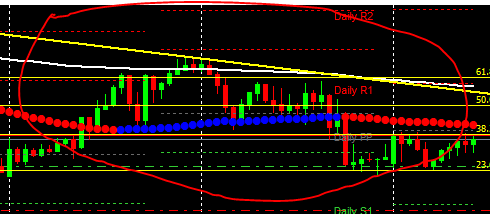
I mistakenly forgot to post my chart in this thread yesterday. From today trend looks likes to be bearish and we are already in correction area. We should now look for some bears.... Yesterday H1 chart (3 Jan 2017....Oops 2018.. !) image
AUD/USD
- shaheer9856 replied Jan 2, 2018
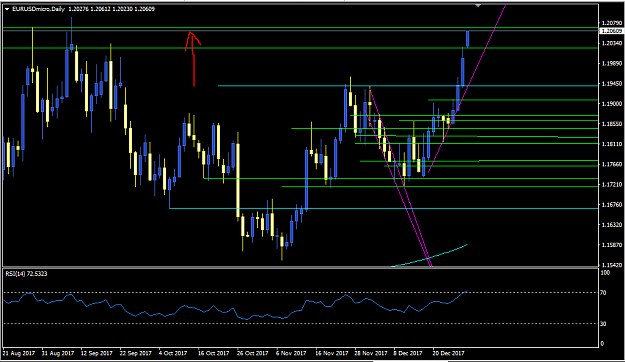
Looks like that bulls are in power. I shall take it long at 1.21000 after 1.20675 resistance breakout. Overbought RSI should continue to some days if it is uptrend. It it downtrend, it should come down and break 1.20224 support. Happy trading ! ...
EURUSD
- shaheer9856 replied Dec 26, 2017
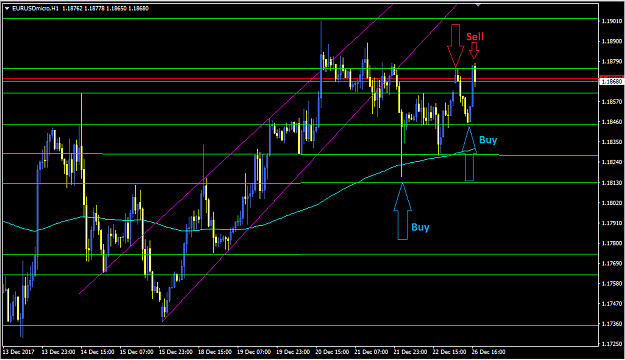
Maybe we could see eurusd bearish impression from today... -It is unable to break 1.19007 resistance -It is unable to break 1.18748 resistance -It has broke major trend lines which is giving forecast of starting bearish trend soon. -It is above 90 ...
EURUSD
- shaheer9856 replied Dec 20, 2017
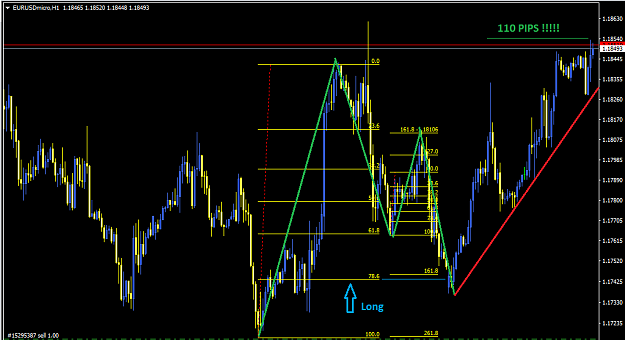
Greetings to them who are closing their those eurusd buy trades, which they bought after completion of "M" gartley pattern at 78.6% of fibonacci level !
EURUSD only . We should now wait for some breakout before taking a decision about ...
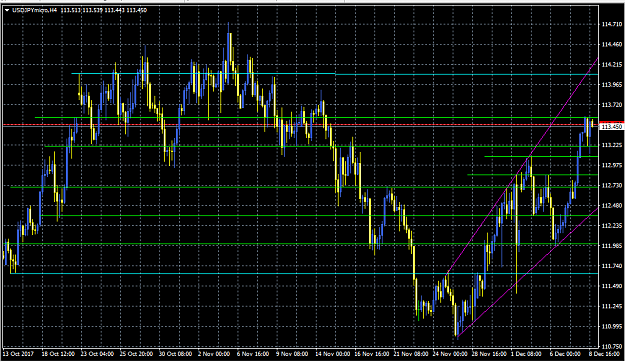
- shaheer9856 replied Dec 19, 2017
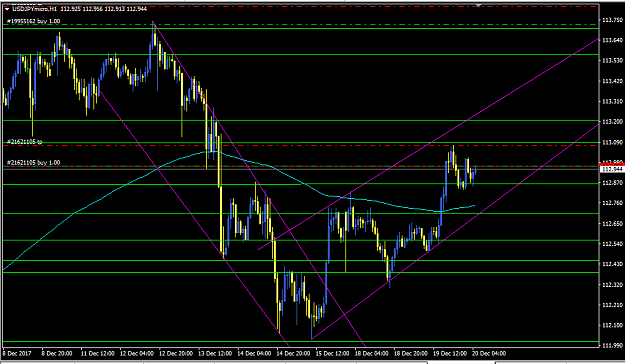
Following simple usdjpy bullish trend, longed it at 112.958 TP 113.073 upto the resistance. Happy trading and New Year ! image
USD/JPY Discussion
- shaheer9856 replied Dec 19, 2017
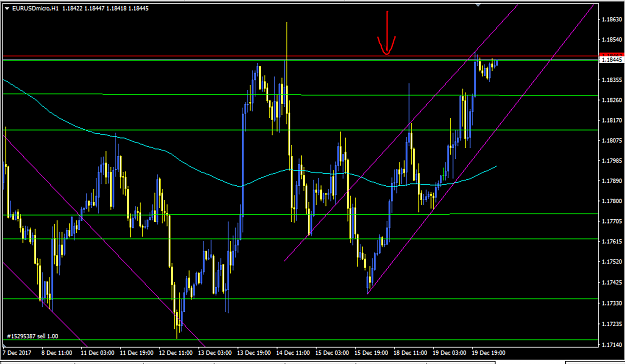
Maybe we could see EURUSD bearish movement today be careful guys.. -Strong resistance is present at 1.18442 area, test count=5 from Nov to Dec. -It is safe to short it when it breaks downward major trend line (pink). -It is safe to take it long with ...
EURUSD only
- shaheer9856 replied Dec 15, 2017
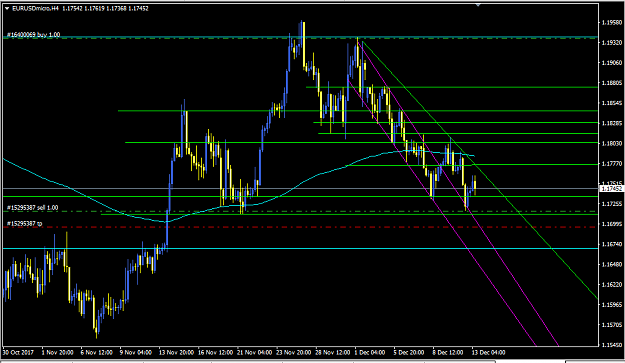
As you all know the down trend of eurusd has started, according to my sentiment, it may continue upto 1.17160 which is strong resistance in H4 and if it breaks it we will see more bearish movement. I think that i have earned too much from this pair ...
EURUSD only
- shaheer9856 replied Dec 13, 2017
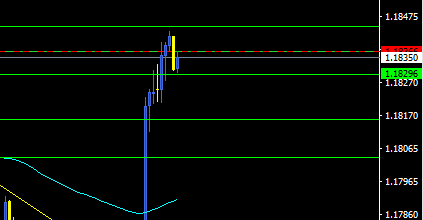
Yes but i think that it is retesting at 1.18295 b'cos there is support under it in hourly chart. Lets see the new price move
EURUSD only good luck !
- shaheer9856 replied Dec 13, 2017
Yes but i think that it is retesting at 1.18295 b'cos there is support under it in hourly chart. Lets see the new price move
EURUSD only good luck ! image

- shaheer9856 replied Dec 13, 2017
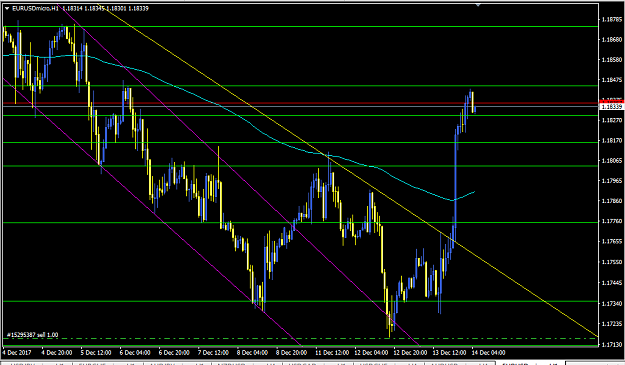
Finally we seen a sharp break out of last major trend line (yellow) and now the price is also above 90 SMA, we should prefer to take it as long after some retracements ! Sell chapter is closed now ...
EURUSD
- shaheer9856 replied Dec 13, 2017
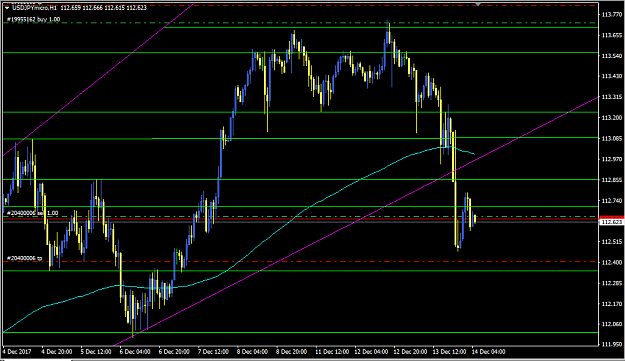
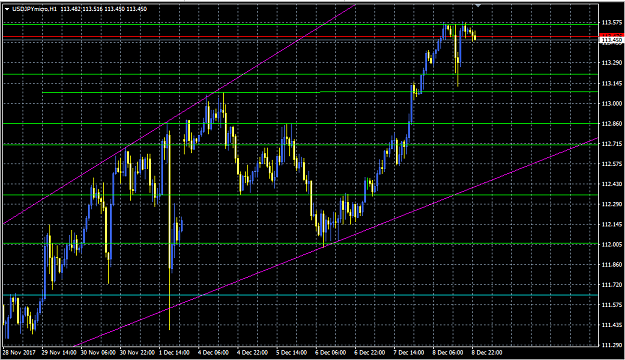
Finally we seen yesterday a pretty downward breakout and we should now enter instantly as the downtrend has been started
USD/JPY Discussion . I am selling it at 112.655 TP 112.405 (upto the next support). Now the price is also under 90 SMA. H1 image
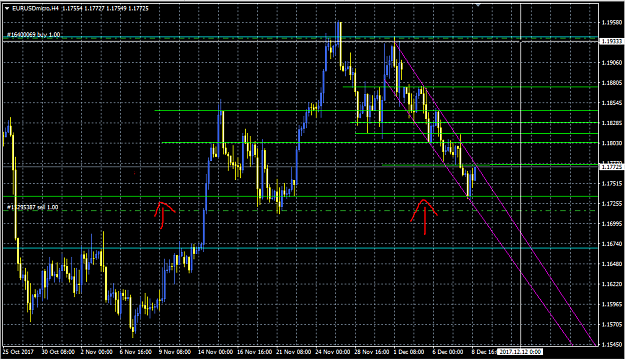
- shaheer9856 replied Dec 13, 2017
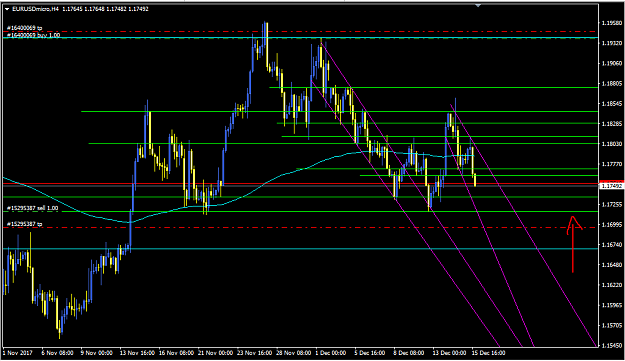
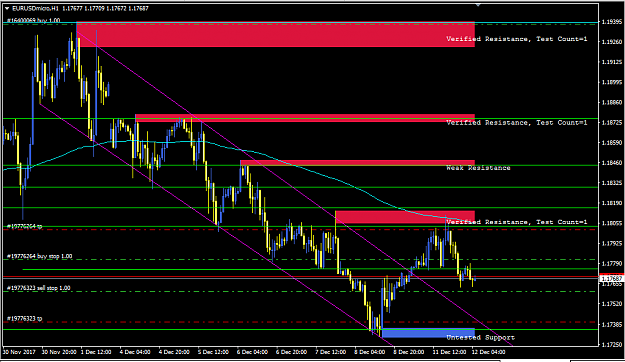
6.59% increase in the Dollar's value maybe effect eurusd and we shall able to see more bearish movement upto 1.16681 and if it breaks support, further downside situation will be possible. Have a profit-full day ! H4 image
EURUSD only
- shaheer9856 replied Dec 11, 2017
The break out of major trend lines seems to be wrong as it has fallen after testing verified resistance. Thank god that i have closed my eurusd buy trade at +10 pips profit otherwise it was in -40 pips today ...
EURUSD only
- shaheer9856 replied Dec 10, 2017
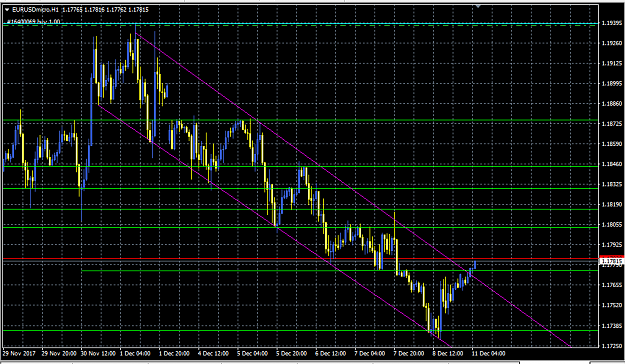
Maybe we could see eurusd bullish impression today as it has broke major trendline and trendline-resistance. Waiting it for come 1.17863 to take it long
EURUSD only Have a profitable day ! H1 image
- shaheer9856 replied Dec 10, 2017
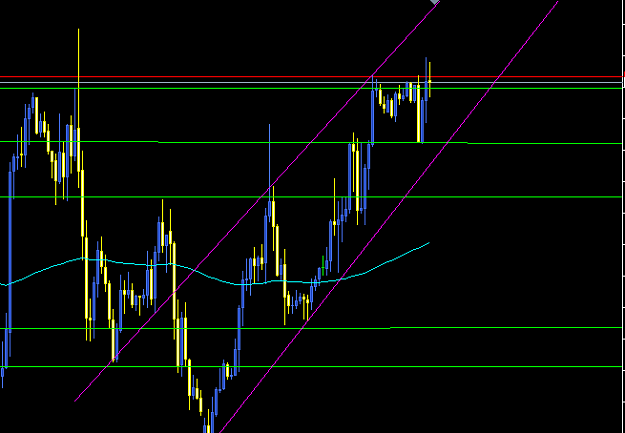
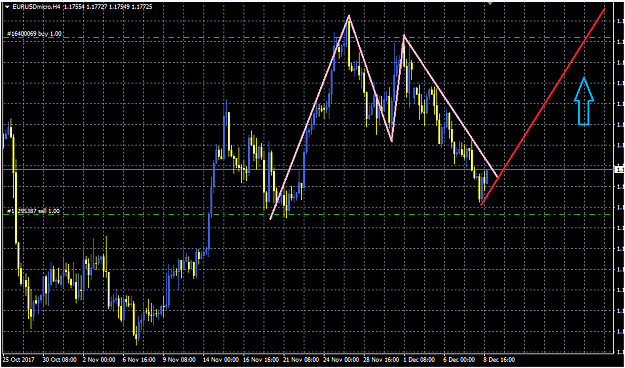
It is showing indications of an upward movement next week. I think "M" is complete and now it will touch 1.19400 second last resistance. EURUSD also touched at second last support and starting a new bullish trend. H4 image H4 (Touching second last ...
EURUSD
- shaheer9856 replied Dec 10, 2017
It doesn't matters for me that it is V shaped, M shaped or W shaped, i will buy it long when it will break upper resistance and sell it short when it breaks downside support !. However, "V" is also a good strategy,,,, but different ...
USD/JPY Discussion
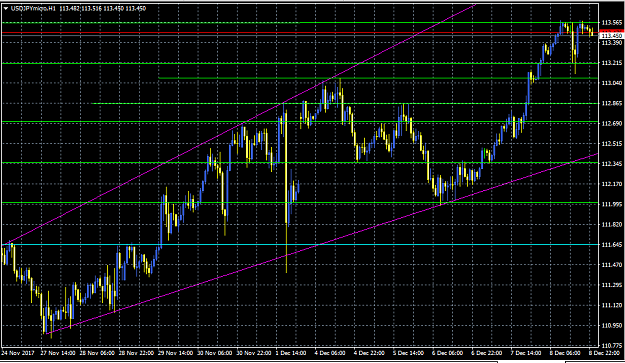
- shaheer9856 replied Dec 9, 2017
Maybe further upside pressure if it breaks the resistance at above, but if it will break the downside support, i will take it as short term. (Green lines are resistance and support levels) (Pink lines are showing trend) (Aqua lines are last support ...
USD/JPY Discussion
- shaheer9856 replied Nov 20, 2017
Is this considered as head and shoulders pattern ?? USD/CHF H1
USD/JPY Discussion
- shaheer9856 replied Nov 20, 2017
Is this considered as head and shoulders pattern ?? USD/CHF H1 image
The Swamp
