- Search Metals Mine
- 31 Results
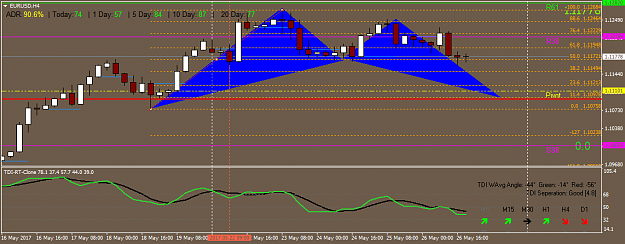
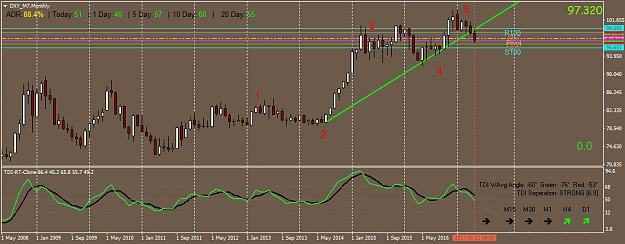
- shaan replied May 28, 2017
In relation to above I have two charts to support Harmnic pattern 4 hourly EURUSD image and long term EW count on monthly US index chart with trend line broken after completing the fifth wave. image
Pivot Trading
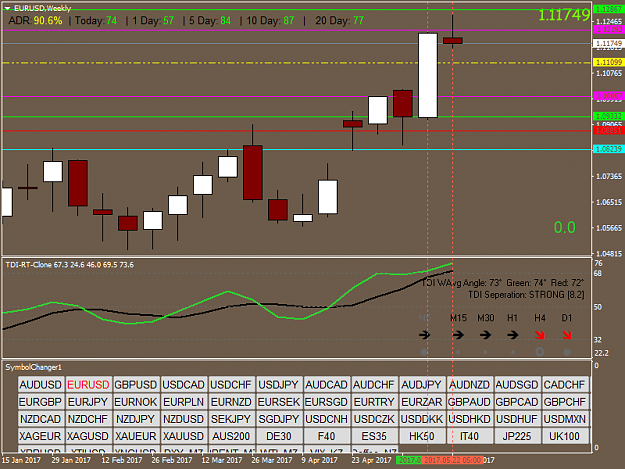
- shaan replied May 26, 2017
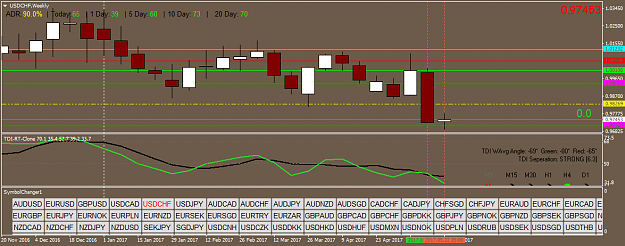
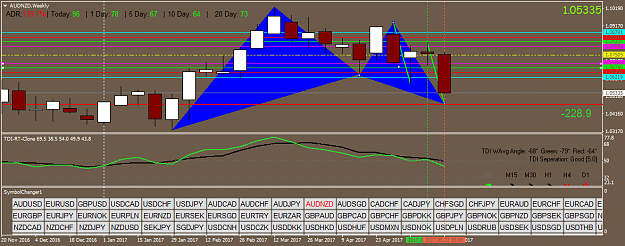
Hi guys Look at the the weekly price action for this week for EURUSD and USDCHF image image
Pivot Trading
- shaan replied Jun 8, 2015
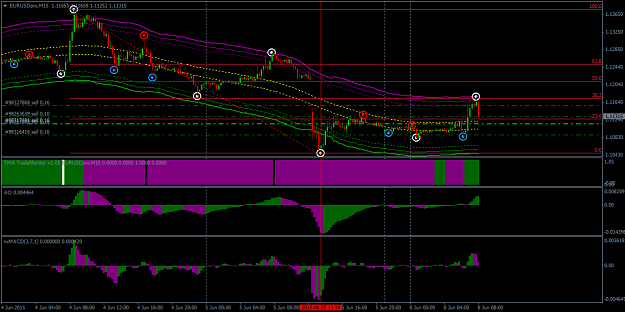
image Please also check/verify your enteries against the fibonacci/pivot/S/R (as also said by sai ram). This will enhance your edge Best wishes
Come Surfing Fx With Me System
- shaan replied Feb 16, 2015
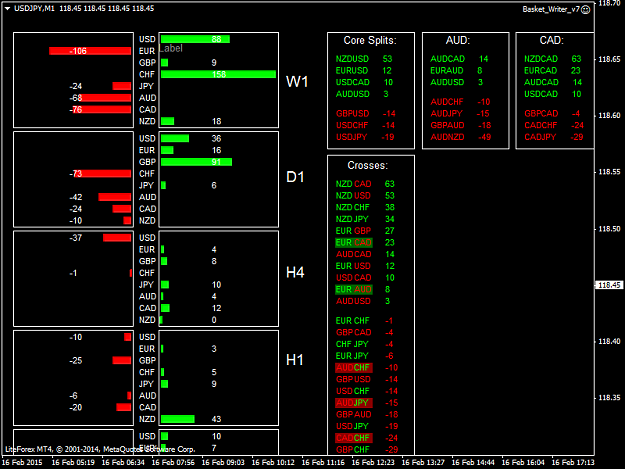
Kindly guide. When I put the the basket writer v 7 EA on the chart. The picture is too big and all the data and buttons do not show. Can someone advise. Regards
Basket Trading EA
- shaan replied Aug 17, 2014
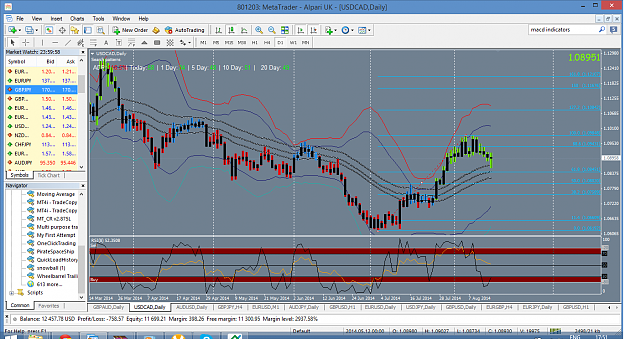
USDCAD Daily RSI bouncing off 50 and %WR coming from 20 and turned upwards. Also next to 38 fib retracement and touching 34 MA.
Davit's BB Wave System
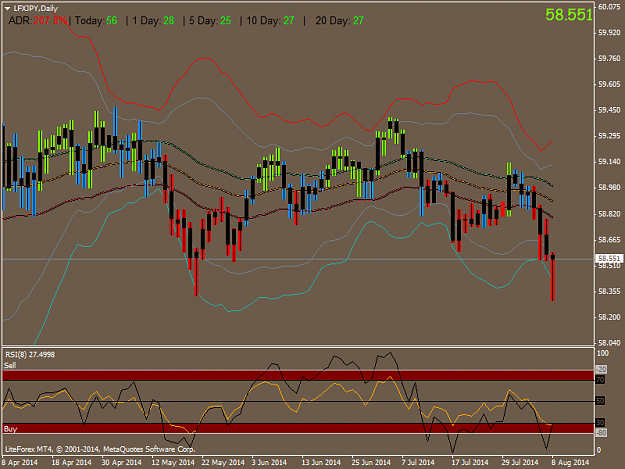
- shaan replied Aug 17, 2014
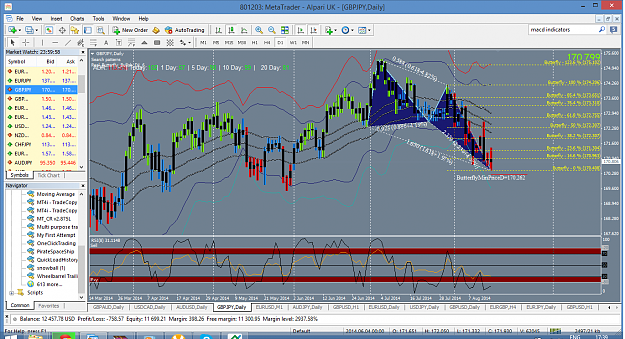
Although GBPJPY is in downtrend mode the following chart points to a retracement
Davit's BB Wave System
- shaan replied Aug 11, 2014
EURCAD 62 pips EURGBP 32 pips. EURCAD taken on daily but shown here on H1 chart.
Davit's BB Wave System
- shaan replied Aug 10, 2014
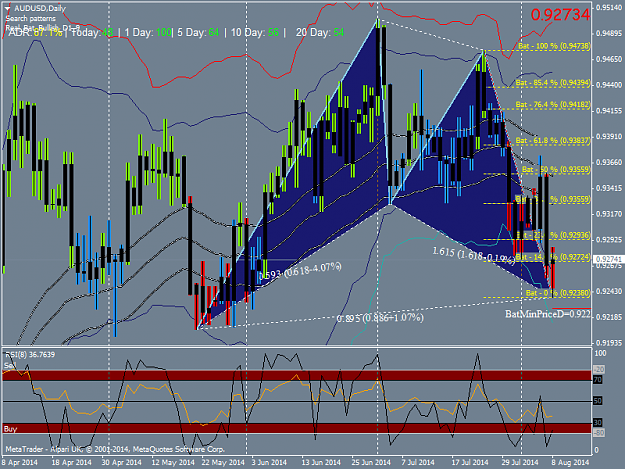
and the AUDUSD daily chart with bat pattern. Also notice RSI divergence.
Davit's BB Wave System
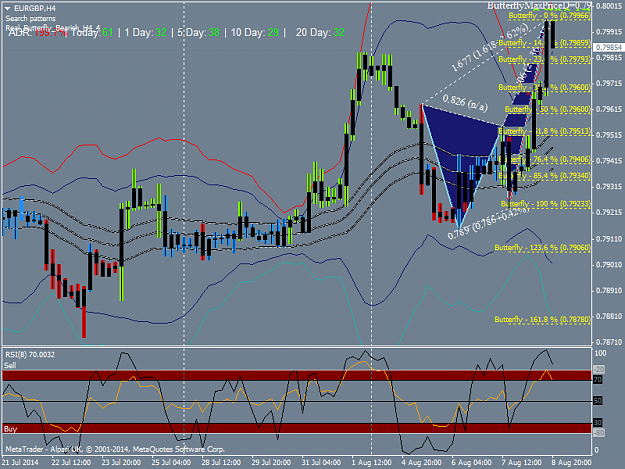
- shaan replied Aug 10, 2014
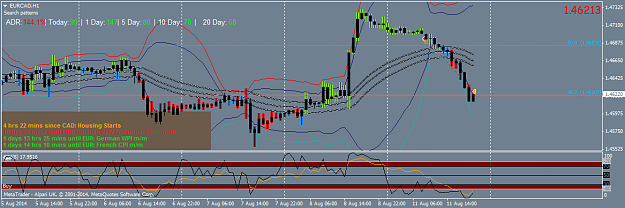
Just for a change, 4 hrly EURGBP chart along with butterfly pattern.
Davit's BB Wave System
- shaan replied Aug 9, 2014
Hi Davit, Thank you for sharing your system. Though I have been following your journal for a while. Happy to see your recent trend modifications as I recently finished 2 week study of Raghee Horner system. Last week recovered a draw down of 1200 ...
Davit's BB Wave System
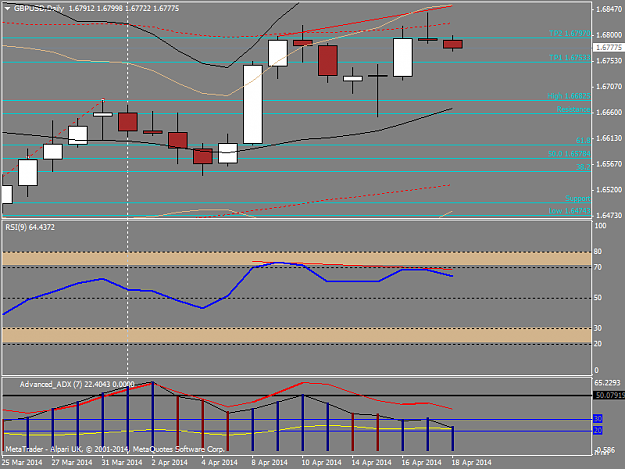
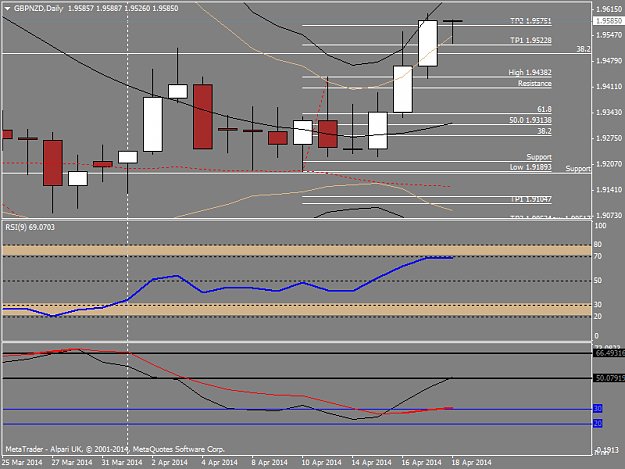
- shaan replied Apr 19, 2014
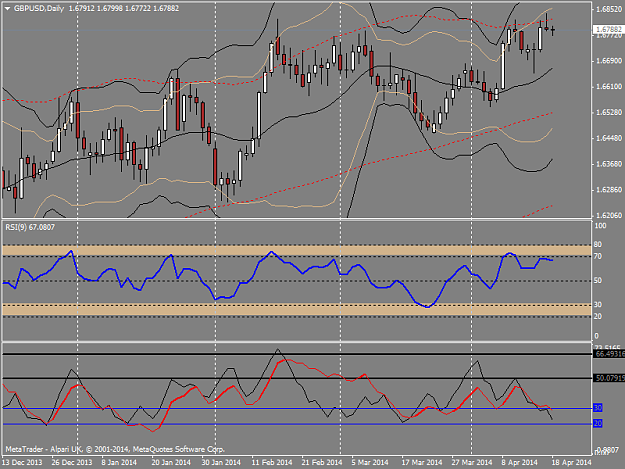
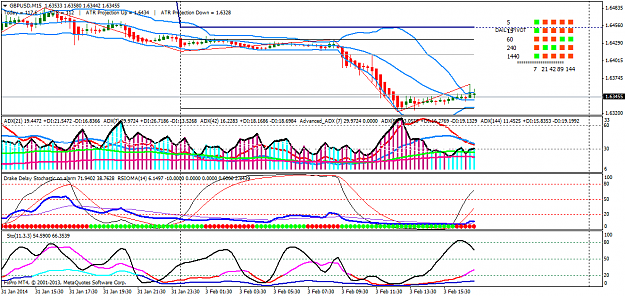
GBPUSD Bollinger Bands extremes and touching 100 BB upper line. RSI 70 with divergence Momentum down Fibonacci extension of 161 met Pin bar Also have a look at GBPNZD
Davit's Confluence Trading
- shaan replied Apr 18, 2014
I also realized visual reference would be more important. I also add RSI divergence to these charts.
Davit's Confluence Trading
- shaan replied Mar 14, 2014
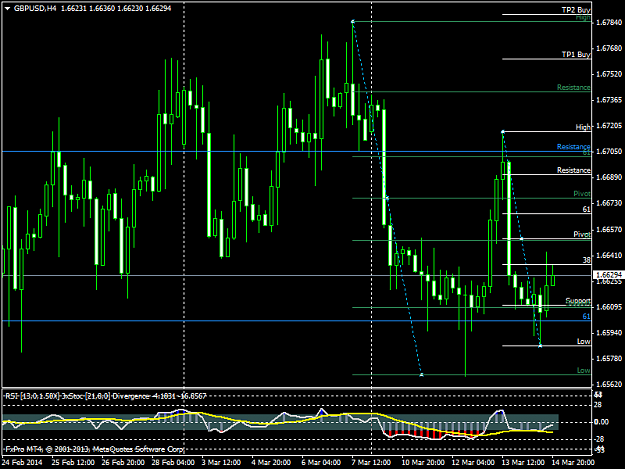
On the same note looking at GBPUSD 4 hrly chart, price above 61 on daily frame and on 4 hour frame has maintained level just above support level from last two swings. Looking for longs.
SimpleFib Trading
- shaan replied Feb 11, 2014
DDS divergence on 5 min with BBS now. Had wonderful experience of gaining 96 pips since last night using Alien's system.
Alien's Extraterrestrial Visual Systems
- shaan replied Feb 8, 2014
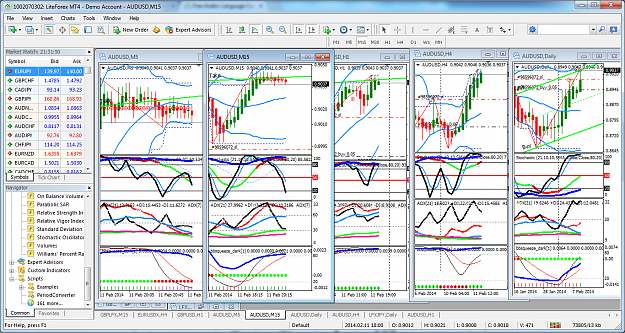
Looking at AUDNZD Daily is moving up with Stoch > 50 and RSIOMA nearing 50. All the stochastics have earlier bottomed out. On H4 one can see a divergence earlier on before the daily start going up. Now RSIOMA is around 80 with DDS divergence. (Alien ...
Alien's Extraterrestrial Visual Systems
- shaan replied Feb 7, 2014
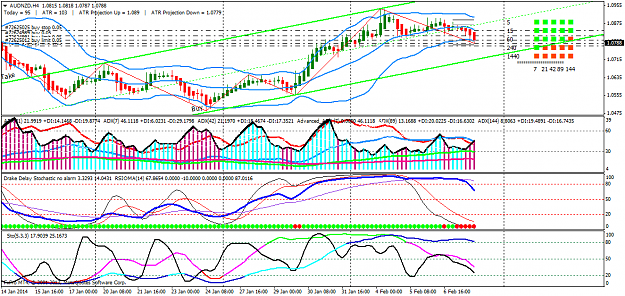
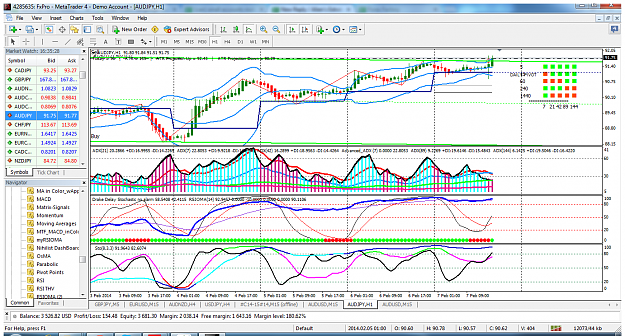
Aussie seems to be quite bullish. Looking at AUDJPY daily RSIOMA turning up from 20 along with DS and all Stochs turning up from bottom with 8,3,3 reaching almost 80, H4 RSIOMA above 80, all stochs more than 50 with green stoch above 80, ADX 7,21 ...
Alien's Extraterrestrial Visual Systems
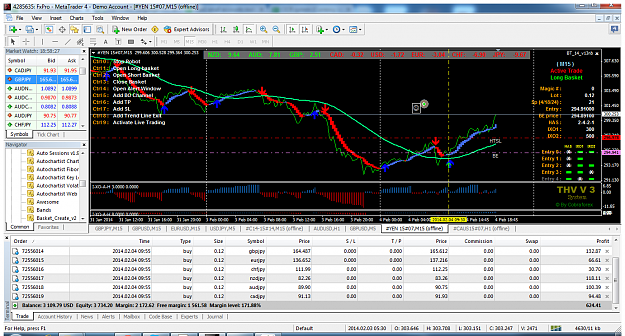
- shaan replied Feb 4, 2014
Thank you sellar 9. 15 min manual entry on jpy basket. Still going strong.
Basket Trading EA
- shaan replied Feb 3, 2014
M15 DS divergence setting up. Thank you for your amazing commentary as it really helped to understand your thought processes. It is mentoring.
Alien's Extraterrestrial Visual Systems
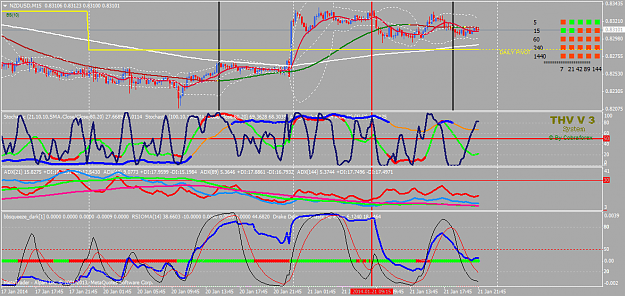
- shaan replied Jan 21, 2014
DS divergence in relation to RSIOMA - We have been seeing great potential of this method. However on the attached chart of NZDUSD 15min I took a long trade on the above basis. But it went down (price and RSIOMA) followed TOWARDS DS although the ...
Alien's Extraterrestrial Visual Systems