- Search Metals Mine
- 25 Results
-
 schmurex replied Feb 22, 2022
Thanks a lot for your help, you were right I was using 3) News Panel v.2.1... The last version v2.2 works for me now! On another note, I use a surface Pro 8 laptop and everything is very small. Increasing the font size and line spacing to 3 and ...
PVSRA (Price, Volume, S&R Analysis)
- schmurex replied Dec 21, 2013
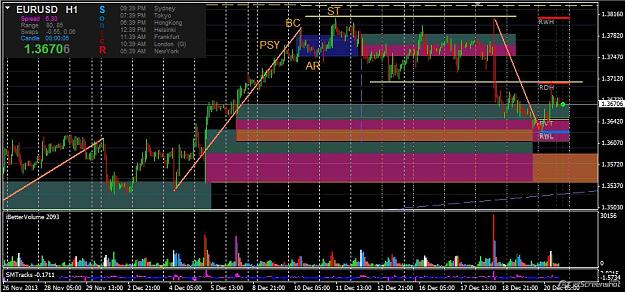
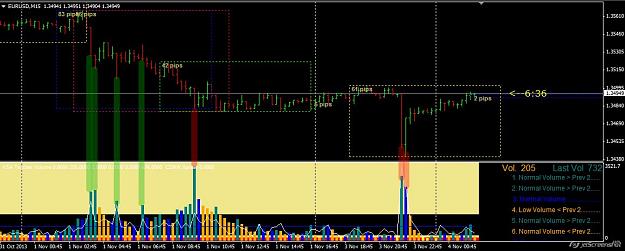
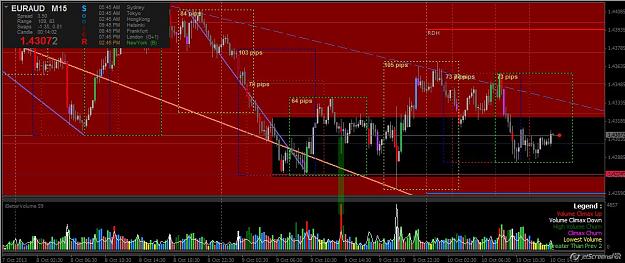
Hi Pres, Following my previous post and to precise a little bit more why I am intrigued by your trigger levels and S/D zones here is my marking of the EU chart, from a Wyckoff’s point of view. The zoned drawn at the UHV candle H&L is very close to ...
vsa with Malcolm
- schmurex replied Dec 20, 2013
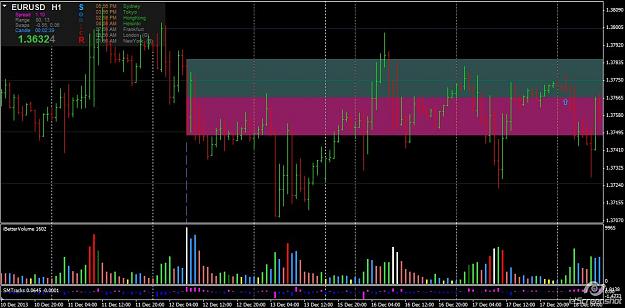
Hi Pres, Thanks for this great post! I hope you don't mind me highlighting some part that I find most intriguing. About drawing a zone from a UHV candle and dividing that zone in the middle, is it what you mean? and if so how long does this zone ...
vsa with Malcolm
- schmurex replied Nov 4, 2013
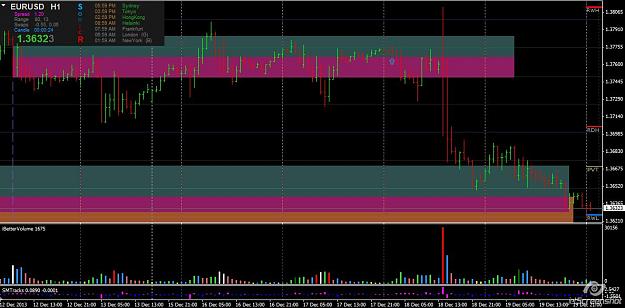
Hello SimpleDev, Thank you for posting this chart. This quiz format is perfect for us new to vsa to learn from the more experts. Please let those charts coming. Ok, I'll give it a try: We have those two huge spike in volume (compared to the ...
vsa with Malcolm
- schmurex replied Oct 22, 2013
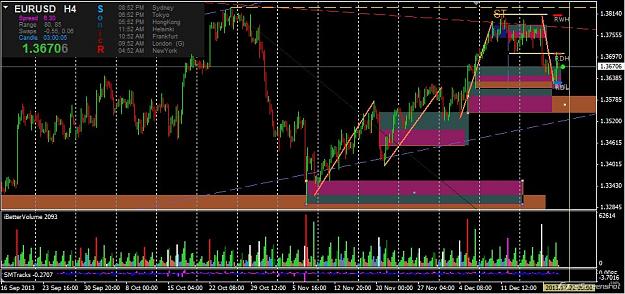
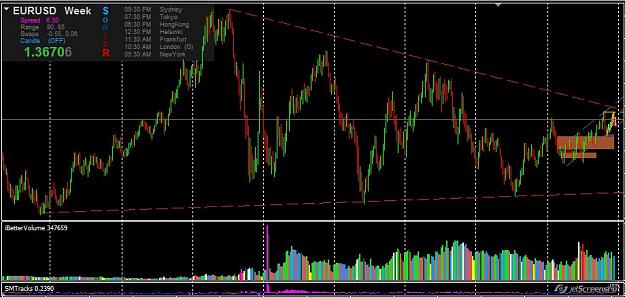
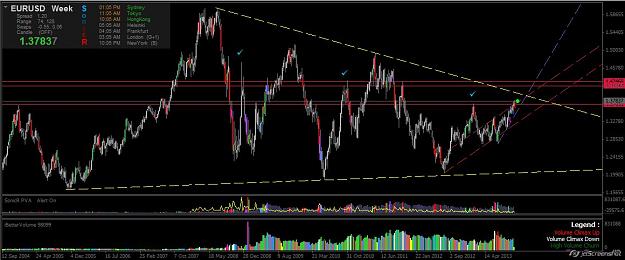
Hi Pres, EU might meet this Upper boundary (dashed yellow line) on its way around 1.3900 to 1.3950, depending on how fast it gets up there. Might not stop it, but will probably react to it. image
vsa with Malcolm
- schmurex replied Oct 13, 2013
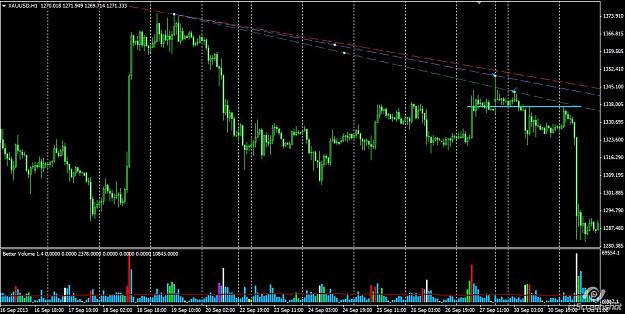
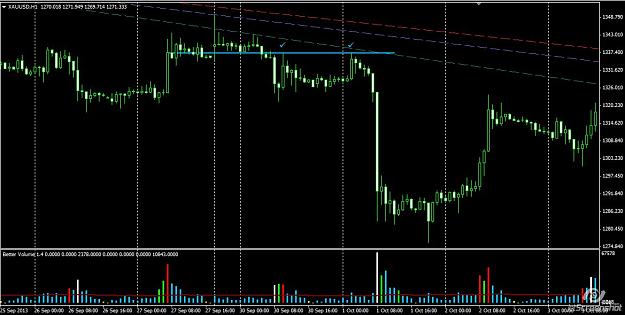
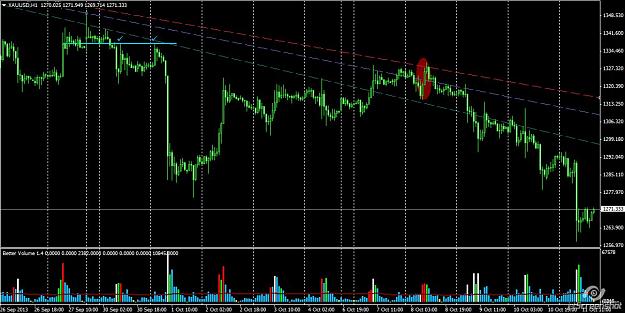
Hello Steve, I know that your post was not directed to me and Maseratie has already answered but I tried to understand your reasoning and what I had missed. The problem might be that different feeds provide different charts: On the first Gold H1 ...
vsa with Malcolm
- schmurex replied Oct 10, 2013
Great thread, too bad it has been deserted. Thanks to SimpleDev and others to keep it alive. I have a problem with iBetterVolume indi from Bandung, so this post is mainly directed to him, but anybody who can look into this is welcome. I believe it ...
vsa with Malcolm
- schmurex replied Jan 13, 2013
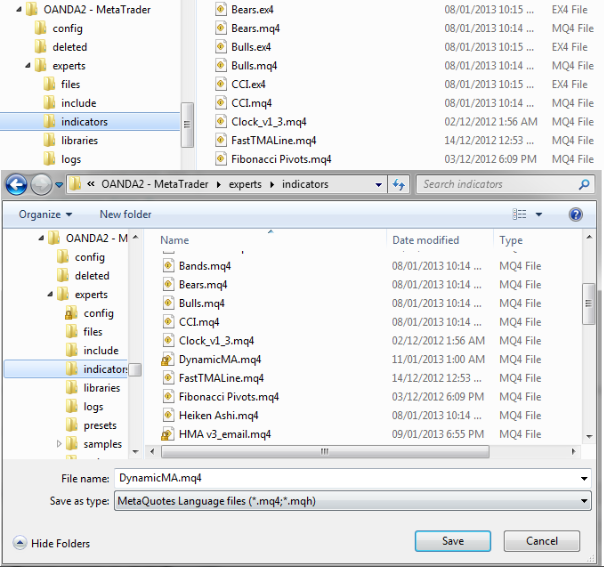
What I mean is that for instance I can't find my Indicator "DynamicMA" in the MT4/Expert/Indicator Folder as you can see in the top part of the attached picture, but it's there as you can see on the "save as" dialog window in the bottom part of the ...
I will code your EAs and Indicators for no charge
- schmurex replied Dec 15, 2010
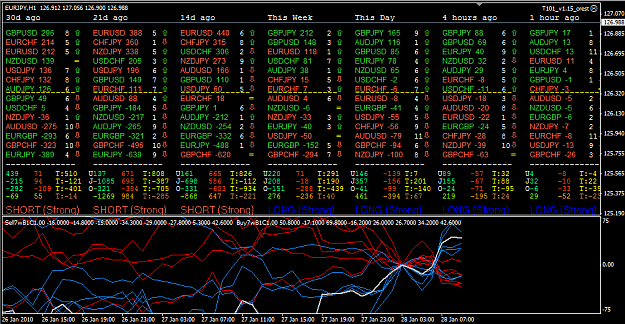
a visual picture of the 14 pairs — Hello Helwan, Here is an indicator I have played with, one year ago for this T101 method. it's far to be perfect but it gives a synthetic picture of the different pairs of the basket and how they move. Try it ...
Indicators development for T101's not very simple method

- schmurex replied Feb 6, 2010
origins... — Thank you Orest for your nice word about my English. So if it’s not mine then it might be yours? Just kidding. But more seriously it’s scary that it’s so difficult to communicate properly within the same language and in such a ...
Indicators development for T101's not very simple method
- schmurex replied Feb 5, 2010
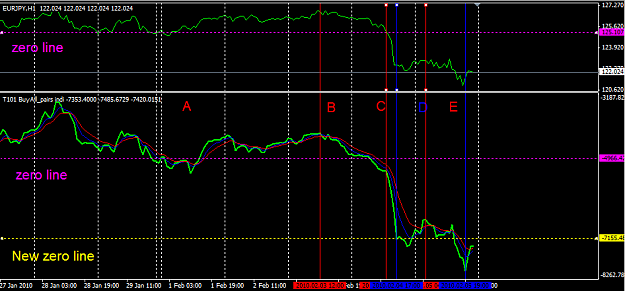
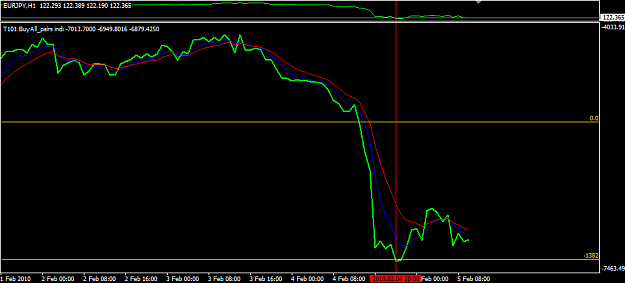
Hi Orest on the line graph of the synthetic basket pair (T101BuyAllPairsIndi) attached, I have put a vertical red line, it reads 2010.02.04 20:00. That's exactly the kind of data I would like to enter as a fix time for the customizable column. I ...
Indicators development for T101's not very simple method
- schmurex replied Feb 4, 2010
Great indicator — Hi Orest, thank you for the amazing work on the EA. the last T101 indicator is great. Actually, I was monitoring the basket trades with EURJPY and I knew it was time to take profit this morning PST when this pair and other ...
Indicators development for T101's not very simple method
- schmurex replied Jan 28, 2010
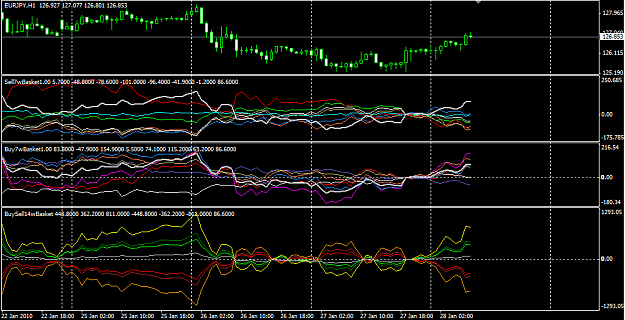
7 red and 7 blue — So, in order to visualize and compare with Orest indic T101v1.15, I have modified those last indics with all the buys in blue and all the sells in red. You can attach the first one to the chart and drag the other one on top ...
Indicators development for T101's not very simple method
- schmurex replied Jan 28, 2010
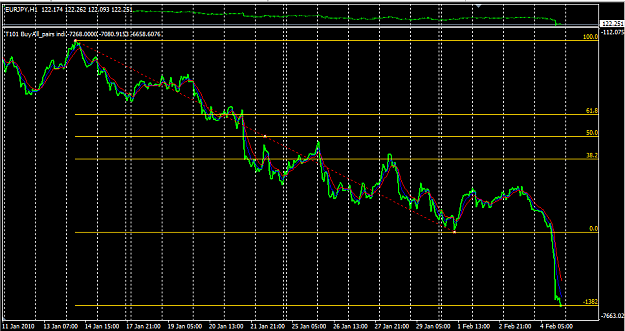
BuySellBasketTotal — Hello Orest and everybody, I'm really impressed by all the work you have put in all these indics. I am late too the party but I have read most of this thread and T101's. I have picked this "BuySellBasketTotal" indic quite ...
Indicators development for T101's not very simple method
- schmurex replied Apr 15, 2009
USDCAD Volumes — Does this answer to your question? as long as volumes in Forex are reliable, Euro session seems the best.
No Brainer Trades
- schmurex replied Feb 12, 2009
USDCAD — my sell limit placed yesterday eventually paid off. already 73 pip locked in with a 45 pip trailing stop
No Brainer Trades
- schmurex replied Feb 11, 2009
Here you are, at least 5 touches it reacted from (more if you count a 10 pip zone around this level) and there is obviously more on a smaller TF. Maybe I'm not seeing it right???
No Brainer Trades
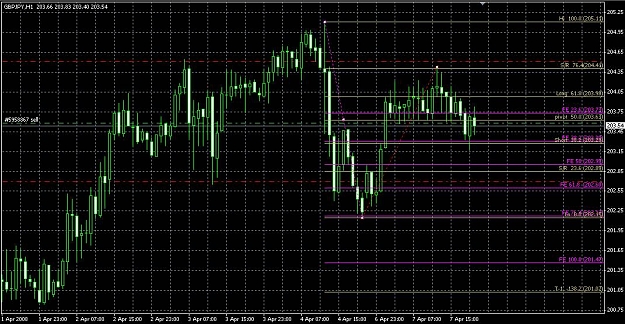
- schmurex replied Apr 7, 2008
Thanks — What about this one I took earlier? Still a little bit in the red. Wrong time of the day, maybe? Thanks
GBPJPY scalpers
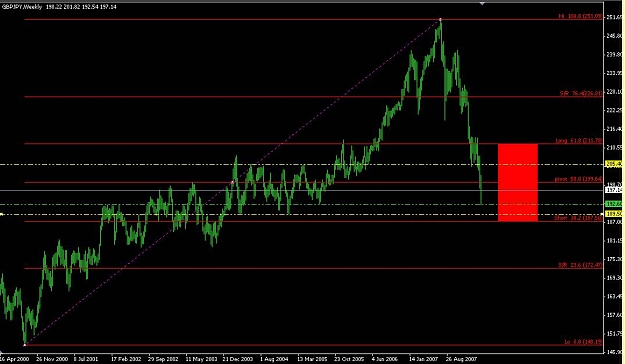
- schmurex replied Mar 22, 2008
W1 — Sorry, The head and shoulder is the one on the W1 chart. I only demo trade so far. I woudn't trade live before increasing my demo account to 200%.
GBPJPY scalpers