- Search Metals Mine
- 26 Results
-
 rogertaggart replied Dec 6, 2019
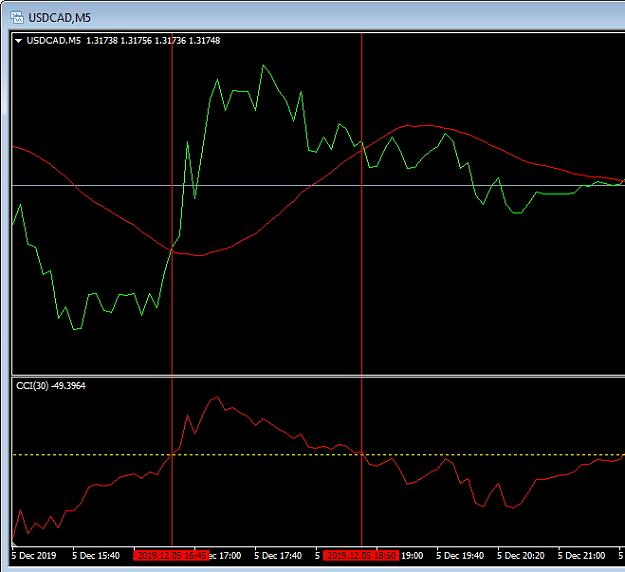
it means two CCI oscillator lines being used at the bottom panel area. A slow and a fast one. Can commonly be called Woodies CCI although thats another whole trading system in itself but similar 2 cci principle (e.g. url ) And let's not forget what ...
A very simple system - trade with arrow
- rogertaggart replied Oct 22, 2019
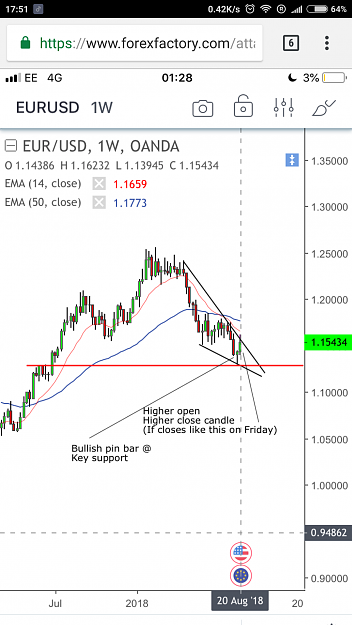
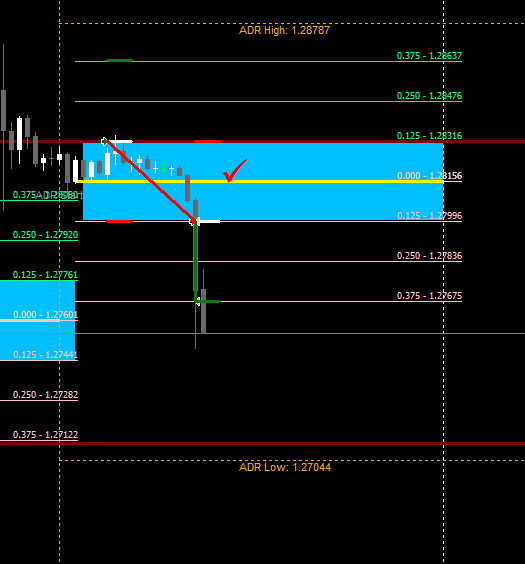
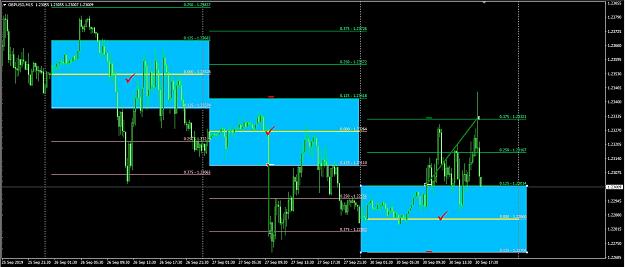
Update: unlucky on friday 18th. Missed profit by 1 pip even though candle looks like it crossed. Monday didnt trade due to Saturday vote in parliament. Was expecting a gap. And today was a win image
Lazy Open Trading
- rogertaggart replied Oct 21, 2019
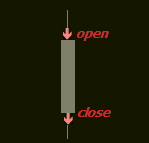
This is hopefully a simple alteration to this Halftrend indicator... can the user have 2 choices for the arrows to plot on either the open or close position of the relevant bar in question. By open or close i mean that exact point on the candle i.e. ...
I will code your EAs and Indicators for no charge
- rogertaggart replied Oct 17, 2019
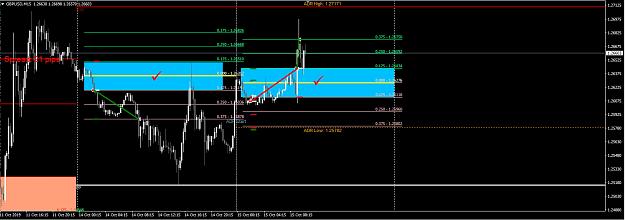
oh well, it was as per the rules. ho hum back to winners today image
Lazy Open Trading
- rogertaggart replied Oct 15, 2019
yes very quick start. Martingale proved useful image thx for the Murray indicator
Lazy Open Trading
- rogertaggart replied Oct 14, 2019
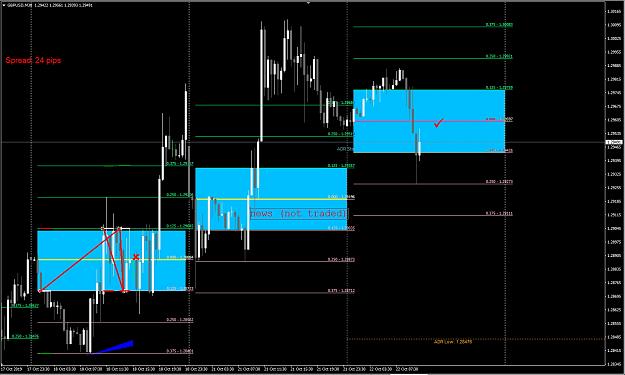
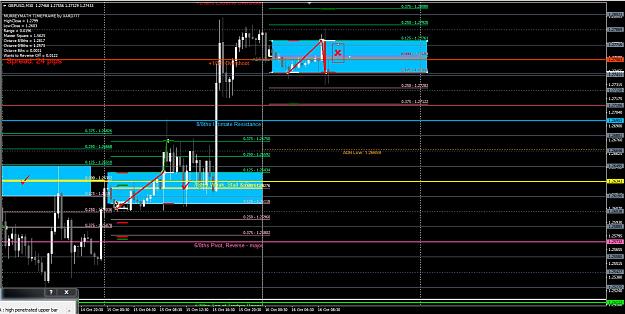
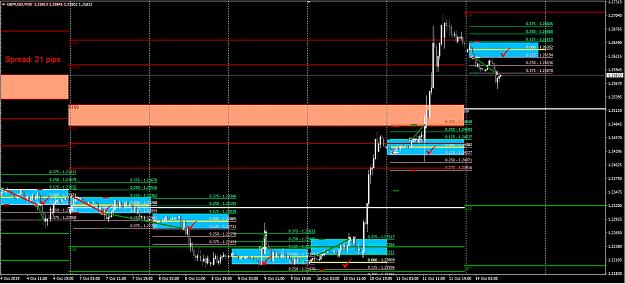
lol Dave, I see how it fits but thats recent price action. But you've been using 31 pips for a while now. Well its works. Another win this morning: image
Lazy Open Trading
- rogertaggart replied Sep 27, 2019
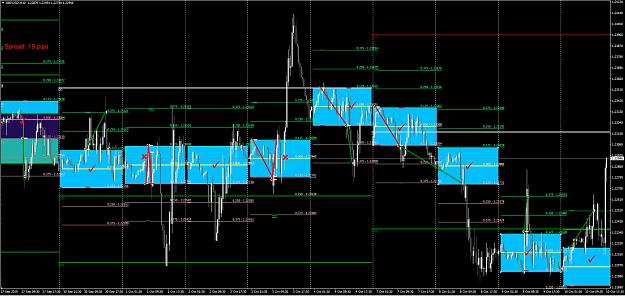
nice result for today for GU image I am looking at the GU history and have only gone back 30 days so far using a 1 step martingale. 24 wins and 4 losses 4 martingale losses equate to 4x3 = 12 standard losses so actual win rate is 24wins/12 losses ...
Lazy Open Trading
- rogertaggart replied Sep 24, 2019
make sure all indicators in the window have the 0/100 min max or if you choose another set of values make sure they are consistent for all indis in the window e.g. image
Southern Cross Trader

- rogertaggart replied Sep 24, 2019
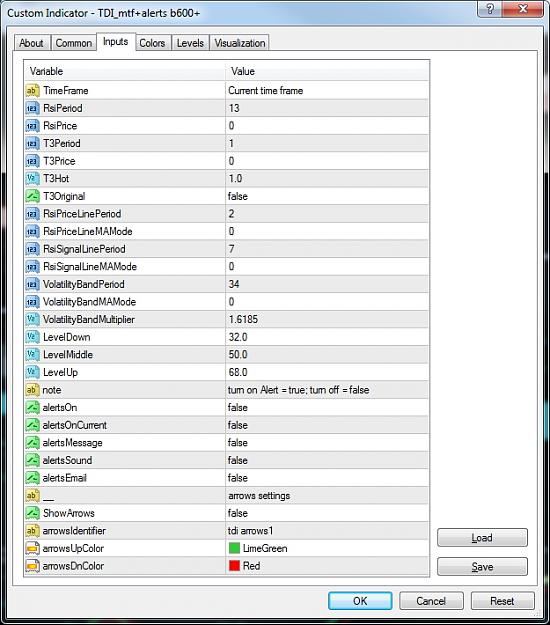
thx for your post can you post the settings you are using for the TDI as my line did not go over the +85 level like yours. Attached are my settings, thx image
Southern Cross Trader
- rogertaggart replied Sep 18, 2019
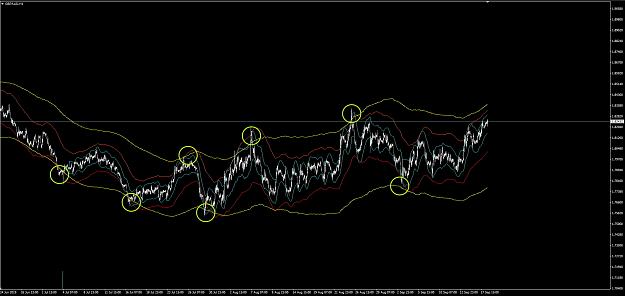
i looked a while ago at superimposing 3 TrueTMA bands on price Below is the same pair for H1 TF Works very well sometimes as per this example. Coincidence of 3 TF extremes. Not so well in others. Obviously a ranging market is best I have enclosed ...
Trading Made Simple(r)
- rogertaggart replied Sep 18, 2019
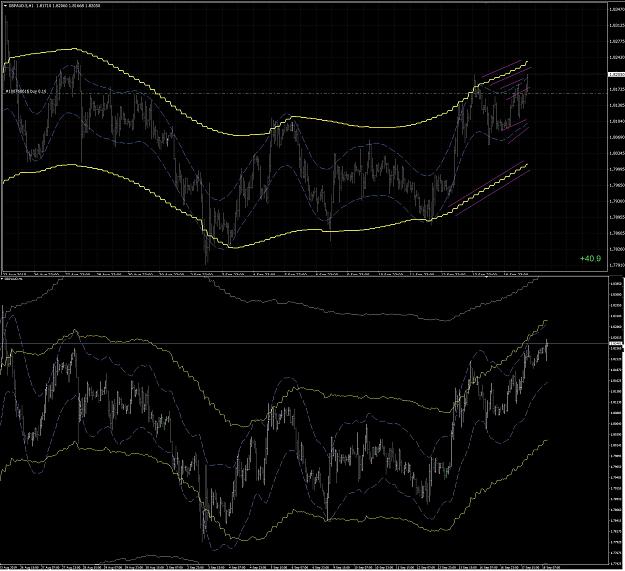
Not an exact comparison because i dont have full settings but in the following image you can see how a true TMA (bottom) doesnt have the nice flow-fit of the repaint (obviously). Draw your own conclusions image
Trading Made Simple(r)
- rogertaggart replied Aug 21, 2019
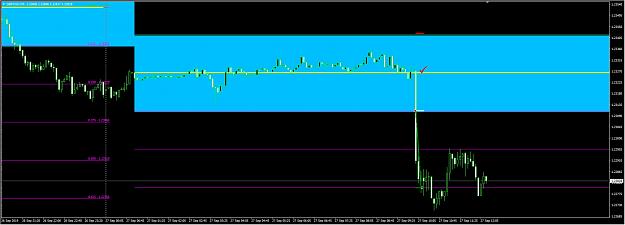
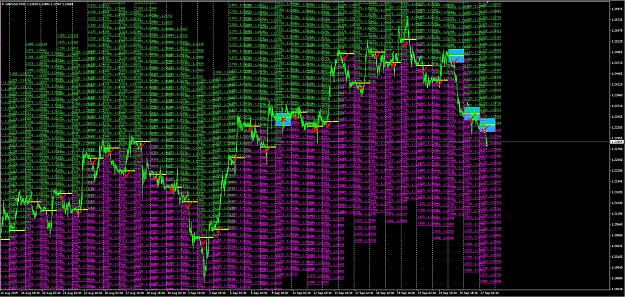
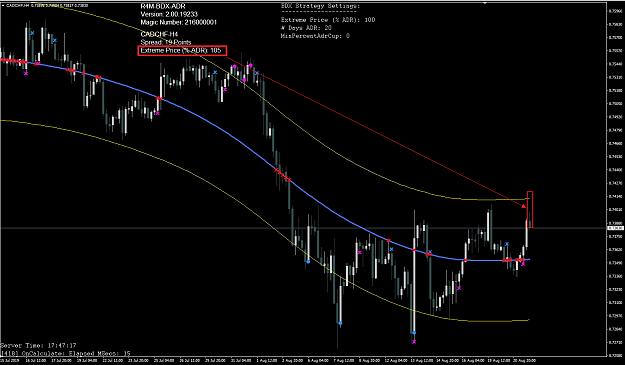
this is going to be a real dumb question but why when it says 105%ADR is price not even reaching the 100% yellow ADR band line? image
(binned per thread starter’s request) MM (Money Maker) Detective
- rogertaggart replied Aug 12, 2019
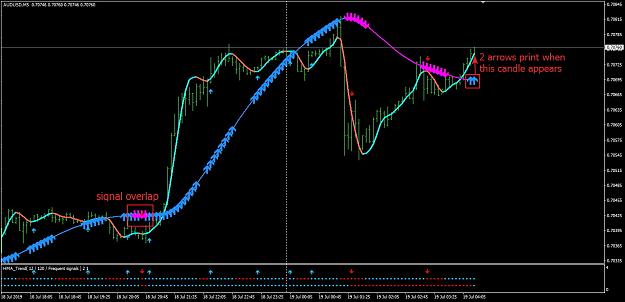
Thx Swingman, nice indicator However, can you clarify how/why we can - get arrow overlaps - two arrows during the first appearance of trend resumption [i.e. a back arrow (one candle in the past) and a current candle plotting at the same time] many ...
Trading Made Simple(r)
- rogertaggart replied Aug 6, 2019
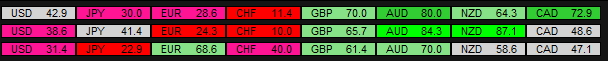
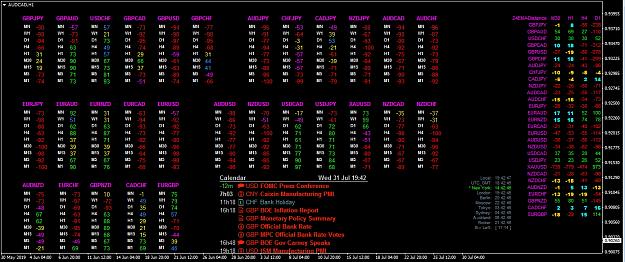
i am surprised no one has ever noticed lower two CSM rows are always identical image also suspiciously similar nos highlighted in yellow boxes to the right the coding that dingdong uses is questionable according to url read posts 20221->20239 ...
Southern Cross Trader

- rogertaggart replied Aug 1, 2019
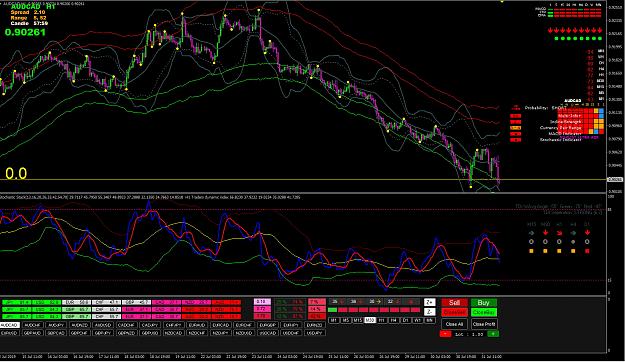
Good Morning All can anyone do me the favour of posting full screenshots of the following templates so i can then compare the onscreen values to see if my setup is compiling/pulling in the correct information As soon as you post, I will pull up my ...
Southern Cross Trader
- rogertaggart replied Jul 18, 2019
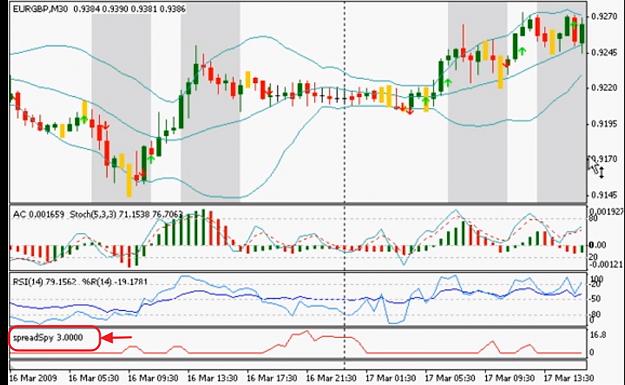
anyone got the spreadspy indicator or a similar oscillator? thx image
I will code your EAs and Indicators for no charge