- Search Metals Mine
- 9 Results
-
 redgreen replied Feb 18, 2015
image Easy to analyze the past. Harder to trade the present.
Point & Figure Analysis
- redgreen replied Feb 18, 2015
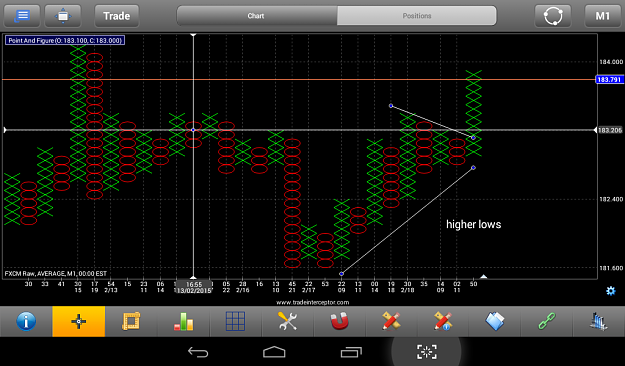
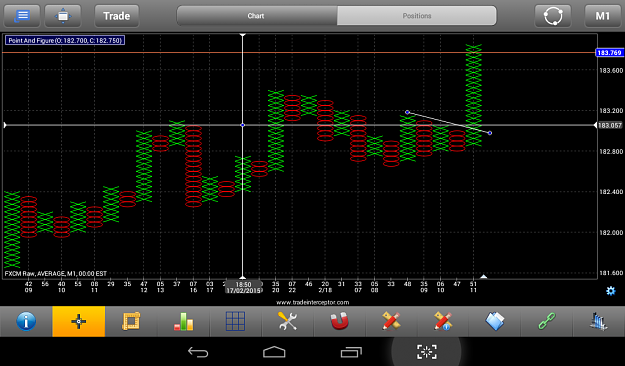
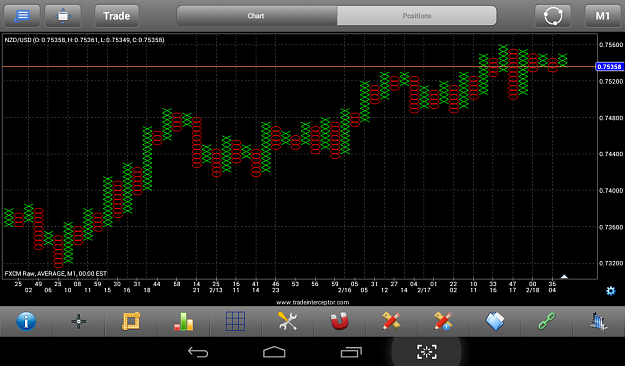
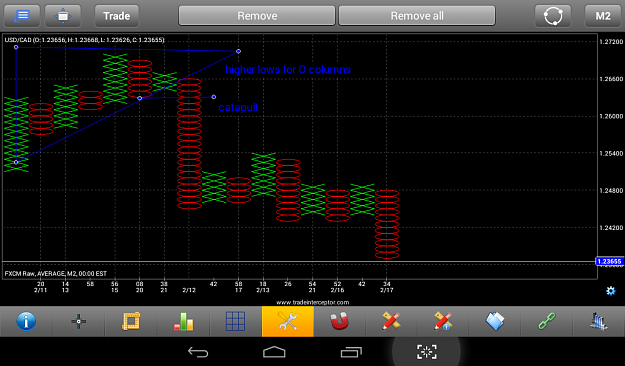
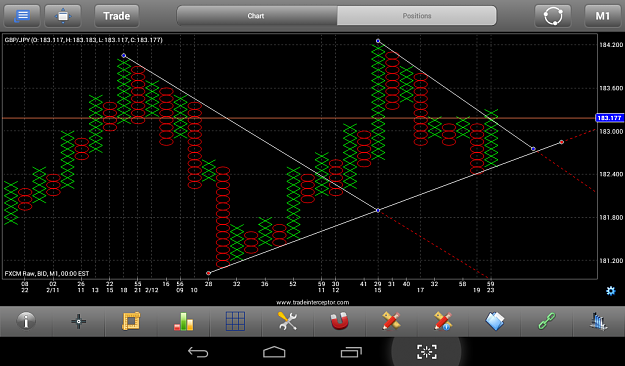
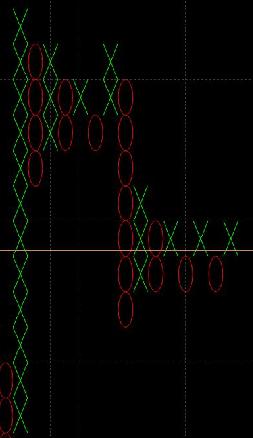
image 10x3 provides the big picture with the higher lows tendency image the 5x3 provides an earlier entry at the continuation of the bullish tendency
Point & Figure Analysis
- redgreen replied Feb 18, 2015
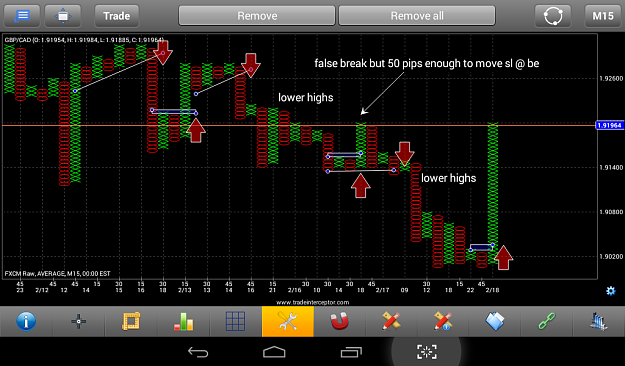
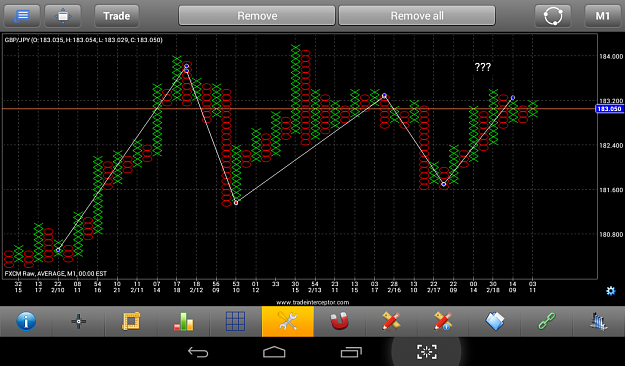
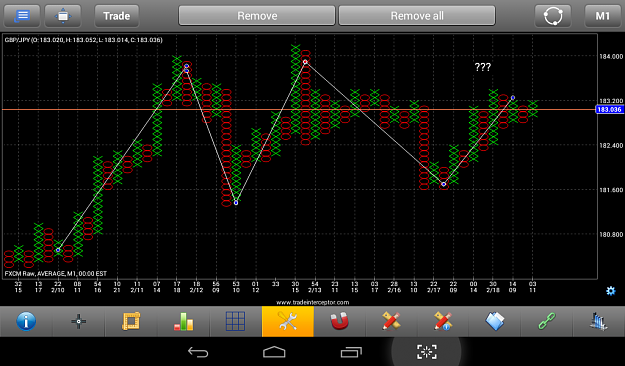
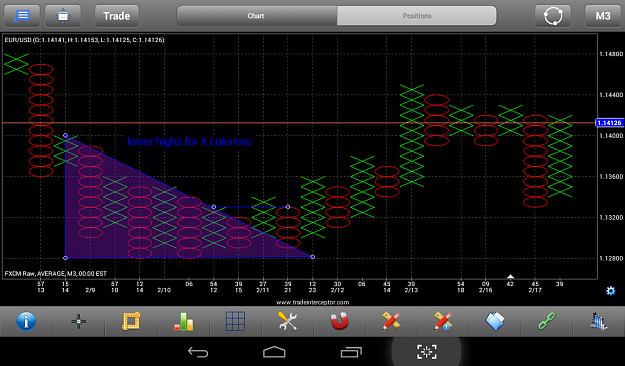
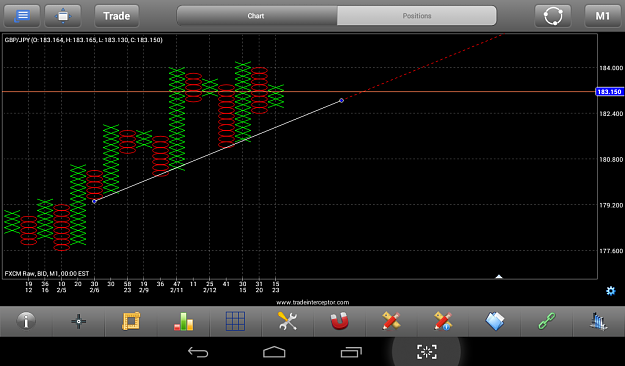
image image This is the same chart with the main waves. Analyzing the sequence of higher lows and lower highs can help identify when such a wave might end. This type of clear movements can't be found on all pairs at all time, this is something I ...
Point & Figure Analysis
- redgreen replied Feb 18, 2015
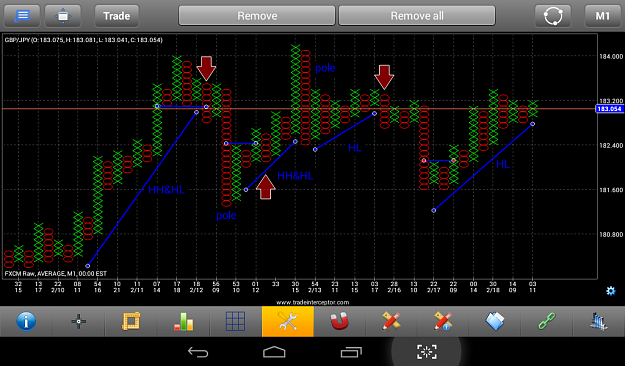
I was talking in general about algos. Personally I like to keep it simple and go back to the basics when I look at how the market moves: higher highs/higher lows or lower highs/lower lows and try to figure out when a wave ends if that pattern of ...
Point & Figure Analysis
- redgreen replied Feb 17, 2015
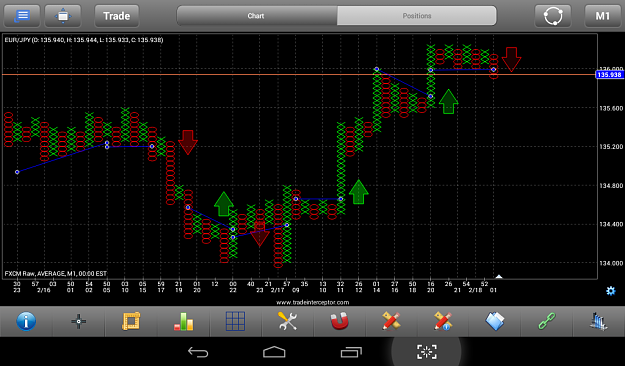
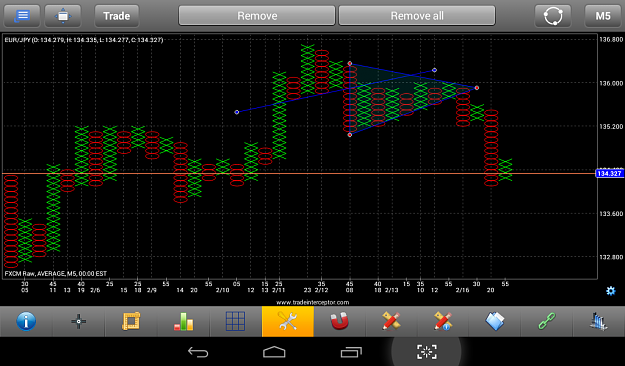
Not all markets will behave so nice every day but when a pair is acting like this if you let the profits run they will cover the losses and leave you with a decent return on investment. eurjpy 5x3 with high/low image I guess the big challenge is ...
Point & Figure Analysis
- redgreen replied Feb 17, 2015
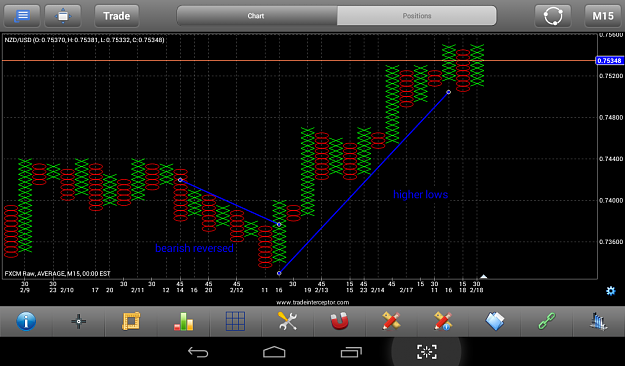
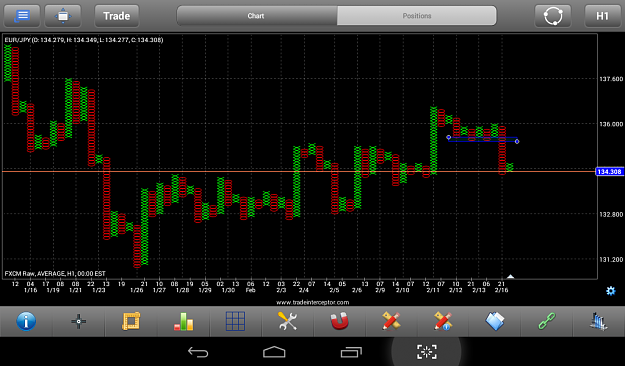
Here is the main idea of what kind of bullish/bearish reversed patterns I am looking for. image image The 1H chart just shows the bigger picture but the entry with bullish reversed with the data for 3 or 5 minutes seems better to me. image ...
Point & Figure Analysis
- redgreen replied Feb 12, 2015
I am starting to really like these charts. I am only starting chapter 3 of the book, can't wait to read it all so I could understand better how to trade with them.
Point & Figure Analysis
- redgreen replied Feb 10, 2015
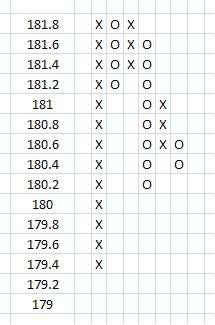
I use pen and paper for my charts but I copied this one into excel so I could post it here. image What I see on interceptor is different. Maybe it uses 20x2 ? image I am using the methods described on stockcharts. I haven't read yet any other ...
Point & Figure Analysis
- Posts by Member Search: 'redgreen'