- Search Metals Mine
- 4 Results
-
 rayn replied Oct 12, 2017
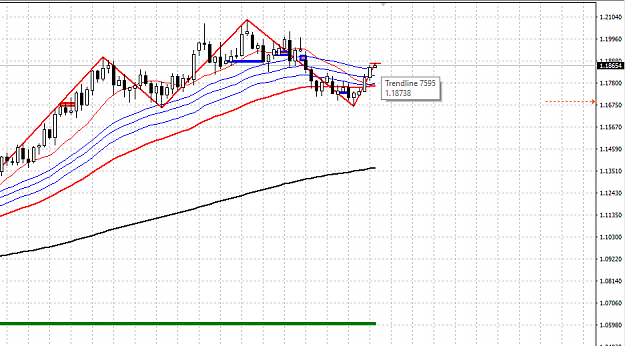
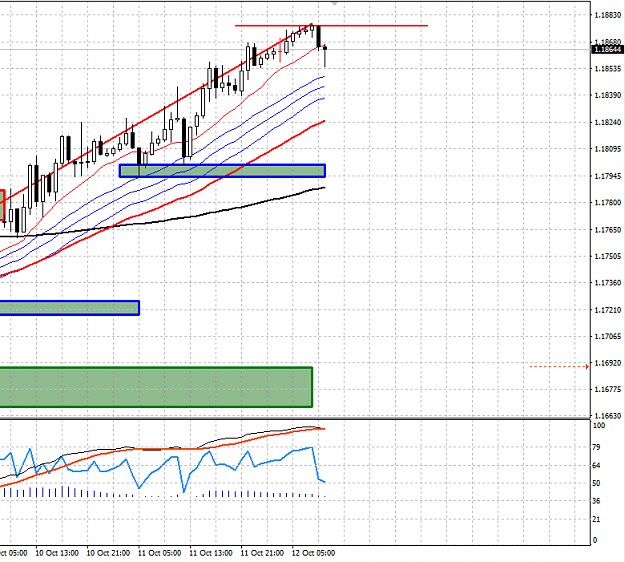
EURUSD just completes a probable Head and Shoulder at 1.1873 on a Daily Chart. Due to its sharp movement on H4 and H1 Traders might want to wait for the 1st sign of weaknesses (ie double top with rsi div on H1 chart or even a lower high and lower ...
EURUSD
- rayn replied Oct 12, 2017
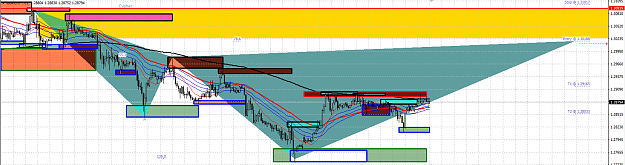
GBPCHF have a decent Bearish Cypher formation at H1 chart. Range to get involve to short 1.3018-1.3092, Initial Stop Loss at 1.3102, Target1 1.2916, Target2 1.2853
GBP/CHF and USD/CHF
- rayn replied Oct 12, 2017
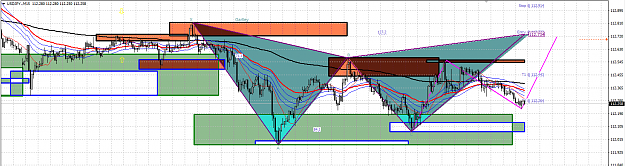
USDJPY completes bearish Gartley formation at 112.73 which coincide with ABCD formation. SL 112.91 which is above H4 resistance, TP1 112.44 TP2 112.26
USD/JPY Discussion
- rayn replied Oct 12, 2017
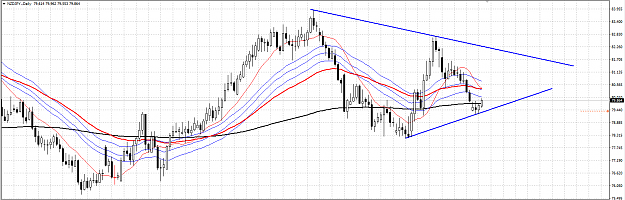
NZDJPY on a Daily Timeframe shows a symmetric triangle. A pretty good price to long actually. 79.50. Missed the trade yesterday as I'm looking at other pairs. Awaiting for the retest to long it.
NZD/JPY
- Posts by Member Search: 'rayn'