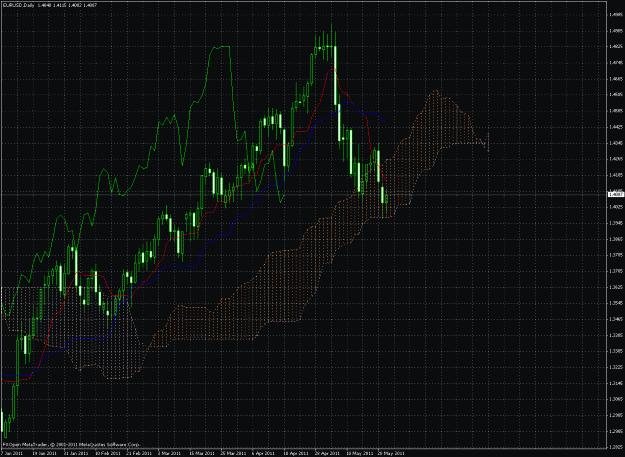
Alright, so I'm looking at my fxopen chart, what I see is this. The cloud is like 20 odd candles beyond price. The red and blue lines are with price. Seems quite interesing.