- Search Metals Mine
- 905 Results (1 Thread , 904 Replies )
- psiholog replied Aug 15, 2011
Back to technical analysis. Since there are some serious bulls in this forum look at this food for thought. The high since the open marks the resistance. The opening "gap" level (which does not really exist) marks support. Whichever level gets ...
EURUSD
- psiholog replied Aug 15, 2011
This thing is going to crash back down any time now....1.435x is the absolute high. How do I know this?...because nothing has changed since last week, in fact the Eurozone is getting weaker and weaker. While technical analysis has less and less of ...
EURUSD
- psiholog replied Jun 21, 2011
There are 2 main factors this week as everyone knows 1)The Greece situation and the solution they come up with 2)The fed meeting tommorow (will they extend qe 2 is the main question) But until then, in one hour is the German Zew economic sentiment ...
EURUSD
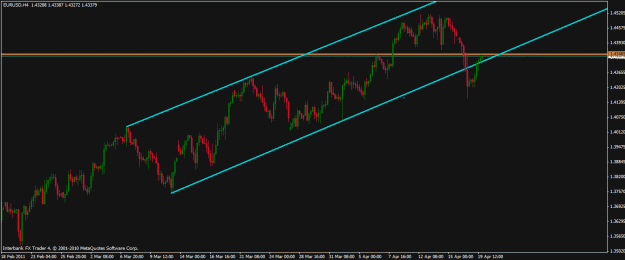
- psiholog replied Apr 19, 2011
You forgot one very essential thing. The majority of people who visit this forum are technicals oriented with a smaller emphasis on fundamentals. The only relevance for most of us fundies has when applied to trading is to be aware of when important ...
EURUSD
- psiholog replied Nov 22, 2010
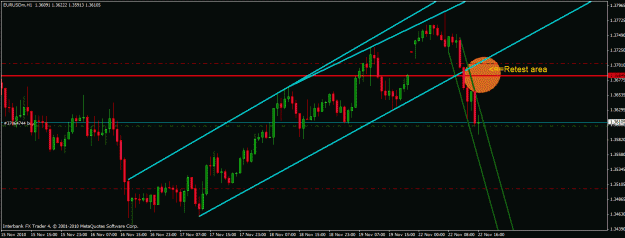
that lack of a retest of the breakout level is exactly why I looked for a long position. As for my entry reasons...I do keep in mind the longer timeframes (4h and daily) which do indeed suggest massive continuation down but my gut feeling (or ...
EURUSD
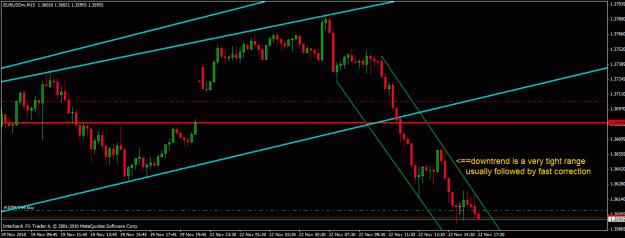
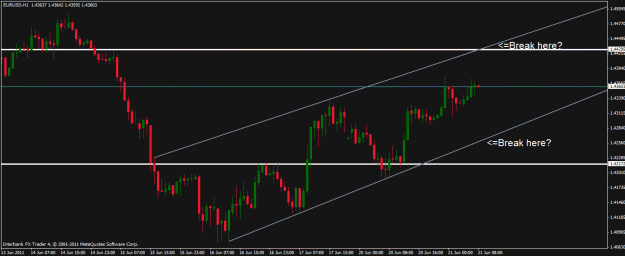
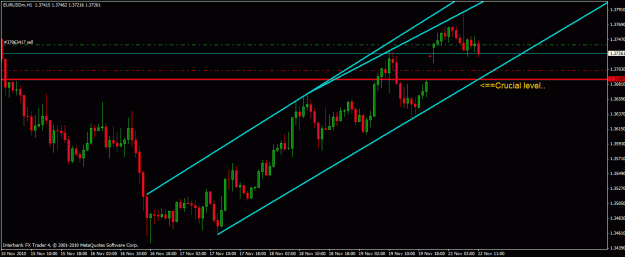
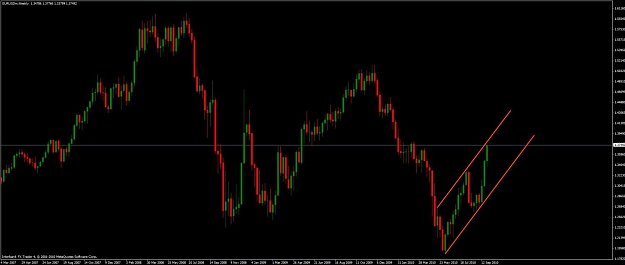
- psiholog replied Nov 22, 2010
So technically we broke down out of that long uptrend quite viciously (or rather bear flag on 4hour chart style). The only thing remaining is a retest of the breakout level to determine whether it has become resistance. If that is the case....here ...
EURUSD
- psiholog replied Nov 22, 2010
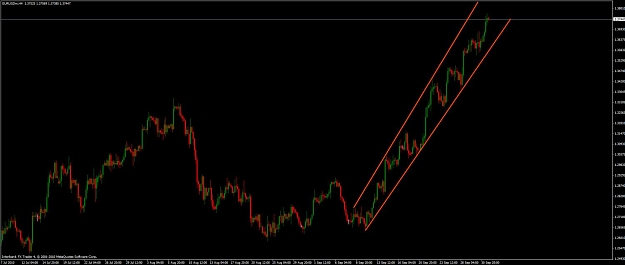
Hello all...just wanted to weigh in my opinion for this week... We have been range bound in an uptrend since 1.346x in what appears as a bear flag on the 4hour chart. This week opened with price action aiming for the upper trendline of the channel ...
EURUSD
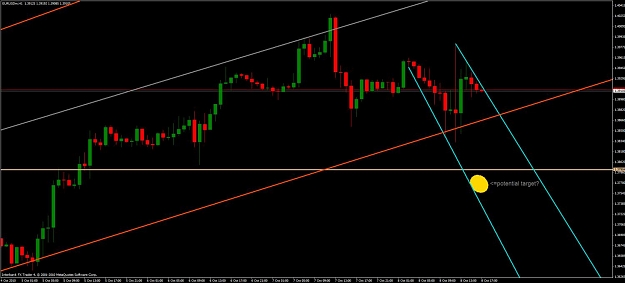
- psiholog replied Oct 8, 2010
Interesting scenario we have here. That longer term uptrend was tested big time around NFP as we all saw. No break. However, the consolidation that has occurred since then could have potentially developed a downtrend channel (blue lines). IF that is ...
EURUSD
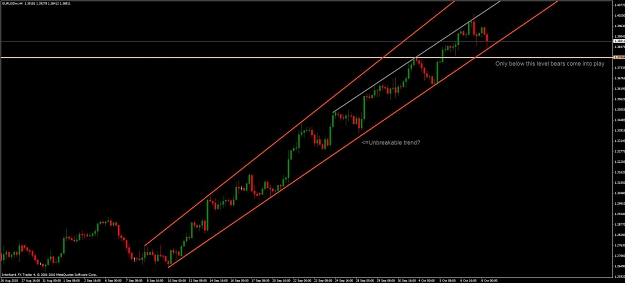
- psiholog replied Oct 8, 2010
It is amazing how powerful this uptrend was. I have never seen such extended automated buying for so long...never on the 4 hour time frame, not even in months when we went 2000+ pips to the upside or downside. That price action in the past was ...
EURUSD
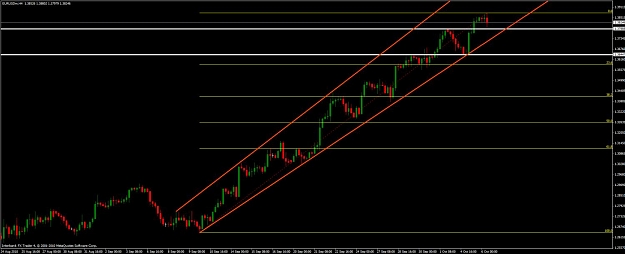
- psiholog replied Oct 6, 2010
Well this is the moment of truth. We should know exactly whats up within the next 12 hours. For the time being we are still range bound in the uptrend since 1.26....every broken resistance becomes support and so forth. image However.....it is ...
EURUSD
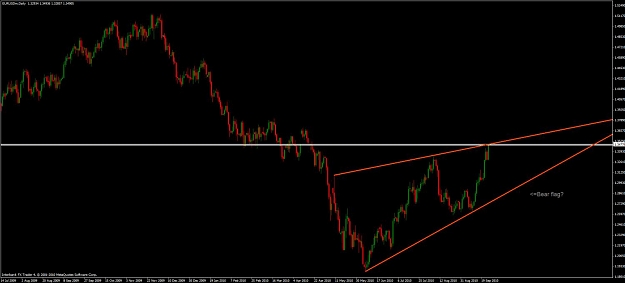
- psiholog replied Oct 1, 2010
As simple as this question is, it is much more complicated then that. You should always be aware of the bird's eye view, whats happening on the larger time frames and gradually work your way down to the smallest time frames possible. In other words, ...
EURUSD
- psiholog replied Oct 1, 2010
Well guys and gals, another consolidation upwards week is pretty much done, and in the process an interesting setup for next week has been created. 1)The uptrend channel from the lows is still intact with pa now testing the upper wall. Usually what ...
EURUSD
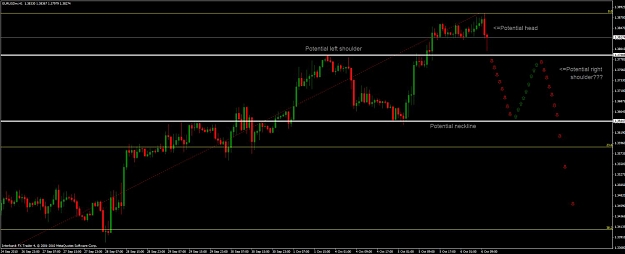
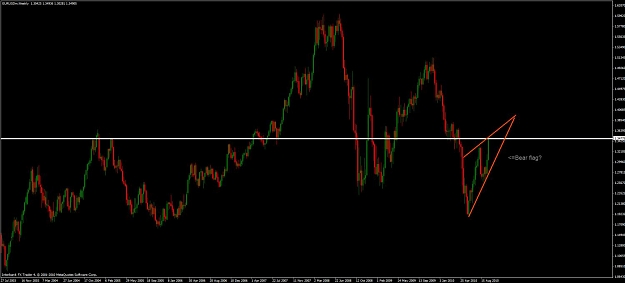
- psiholog replied Sep 25, 2010
I would love to see a chart as to your reasons for being bearish technically. Here is my view. Based on what I see, the month of October has the chance to push us below 1.6..... image Japanese intervention is futile. Their efforts does not change ...
EURUSD
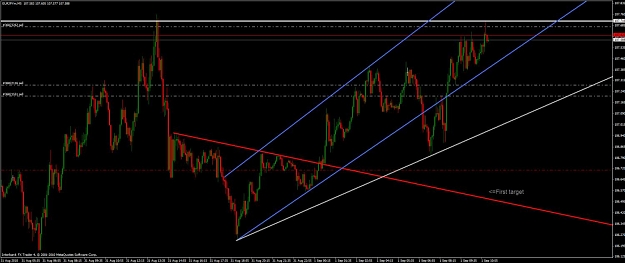
- psiholog replied Sep 1, 2010
Moment of truth now. Just tapped yesterdays high. As I usually do, added a third half a position here with all stops being at 108.20. If it breaks up ...now is the time. And then there's the opposite. Let's see
EUR/JPY Anytime! image
image
- psiholog replied Sep 1, 2010
Quite interesting scenario indeed. 80% of the time in my experience these patterns continue down. This is just another example of the changing times where what was normal, is not anymore. Still, my bearish sentiment holds. I see this current PA as ...
EUR/JPY Anytime!
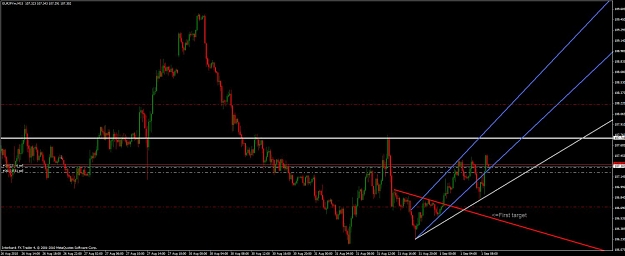
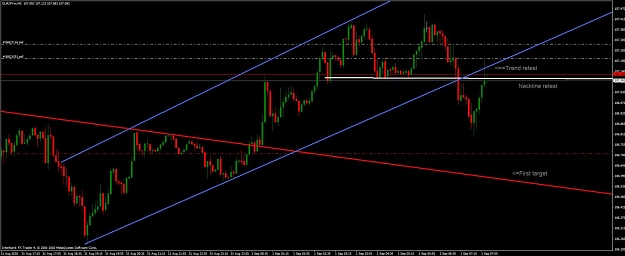
- psiholog replied Sep 1, 2010
Woot...break down occurred. Now we are watching the classic retest of the uptrend and the retest of the neckline to determine whether both have become resistance. This will determine the trend for a while.... image
EUR/JPY Anytime!
- psiholog replied Sep 1, 2010
Here it comes, can we break that temporary uptrend consolidation ?...
EUR/JPY Anytime!
 (first entry was on tap of upper wall, second was during the formation of the double top on 5min chart, both half positions, and usual stop loss 100 pips.) image
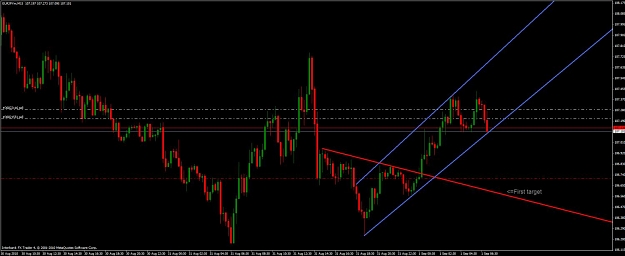
- psiholog replied Aug 27, 2010
Funny how this pair attempted to break up and failed miserably as soon as Bernanke opened his mouth. Now that the uptrend was broken (the bear flag), only one support remains before a retest of the lows. Let's see
EUR/JPY Anytime! image Update: 100pips ...
- psiholog replied Aug 27, 2010
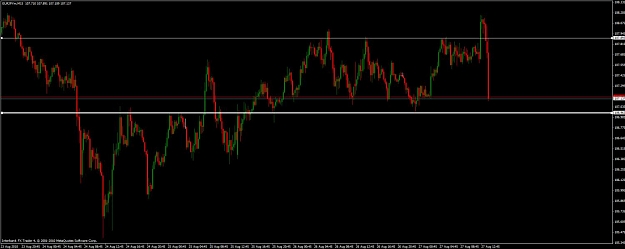
Also for those that love trend lines in their trading, check this out. Notice the massive congestion zone. For those that use indicators, I will take a guess and say things are neutral, rangebound, little direction. For those that use market ...
EUR/JPY Anytime!
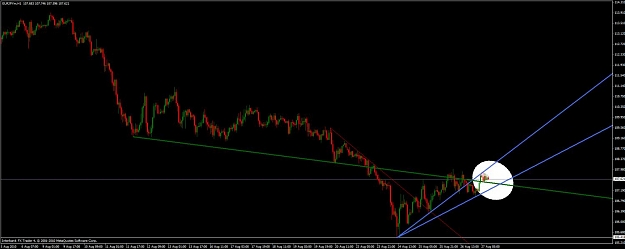
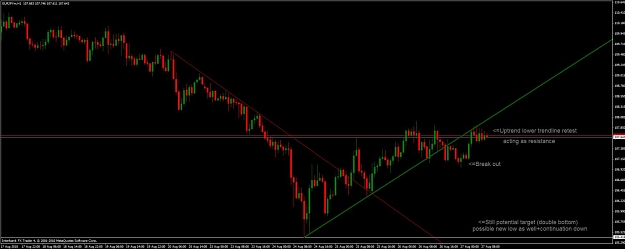
- psiholog replied Aug 27, 2010
22 hours later, the picture hasn't changed much. We did not get a double bottom but we did not get a trend continuation up either. Something interesting has happened though. The uptrend was broken to the downside (hourly chart) and is now acting as ...
EUR/JPY Anytime!