- Search Metals Mine
- 2,116 Results (1 Thread , 2,115 Replies )
- peaches replied Apr 26, 2014
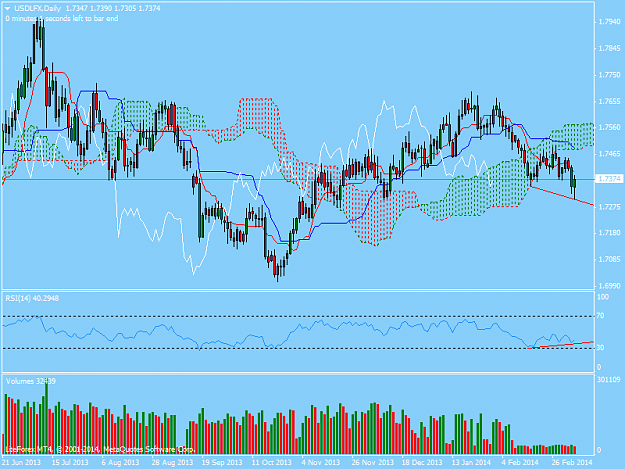
It´s in the charts, again... Big price action to come, looks like summer or early autumn ;-)
Daily candle chart
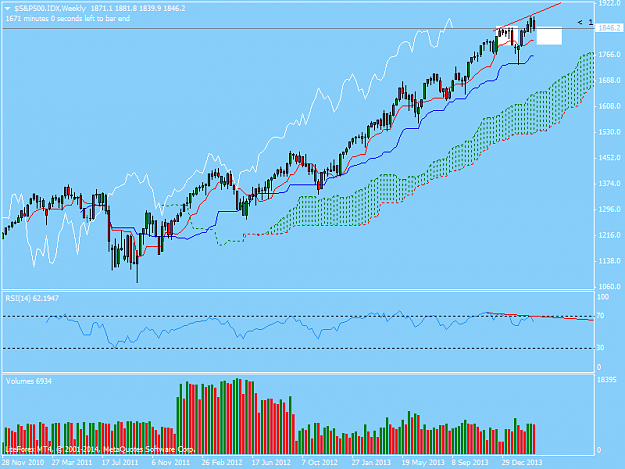
- peaches replied Mar 14, 2014
yeah, the broker always win in this business. Watch S&P 500 for weekly bearish divergence. Perfect to form a head and shoulder pattern in the next 3-4 weeks. If the stocks fall, nzd will fall, and gbp/nzd will rise violently.
GBPNZD trading calls
- peaches replied Mar 14, 2014
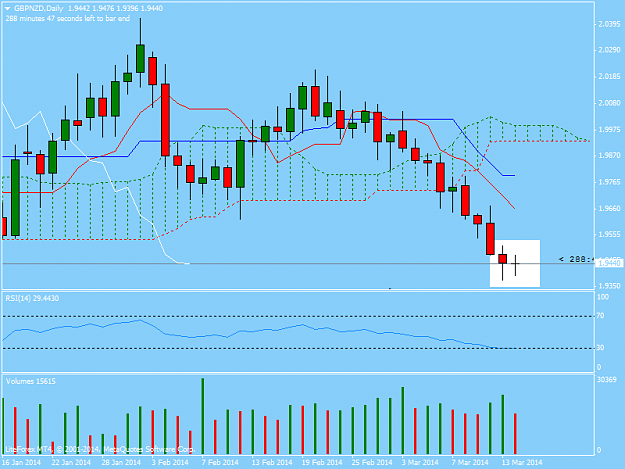
Its funny how the market moves around for 24 hours, so open and close are the same. An upward gap at market opening followed by a daily bull candel and we have a potential morning star formation...
GBPNZD trading calls
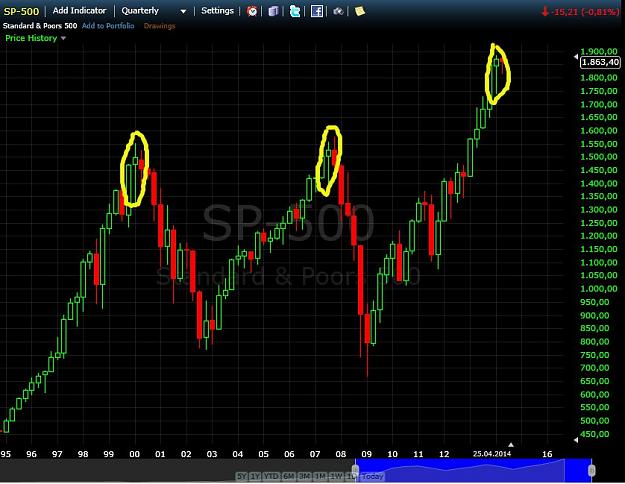
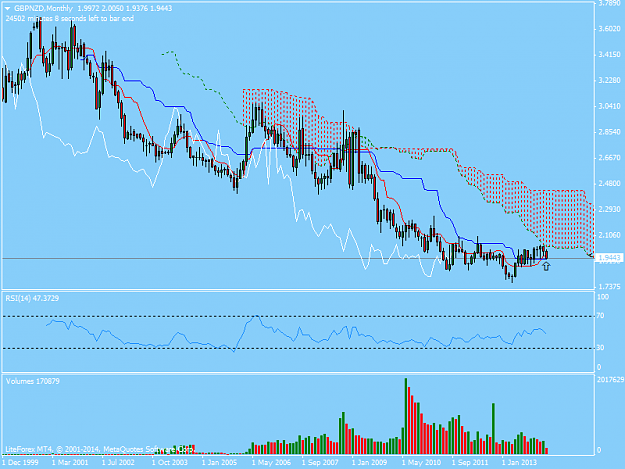
- peaches replied Mar 13, 2014
NZD has a nice connection with the US stock market. Lets have a look at the S&P 500. Each candle represents 3-month. Patience, lets wait for the end of march...
GBPNZD trading calls

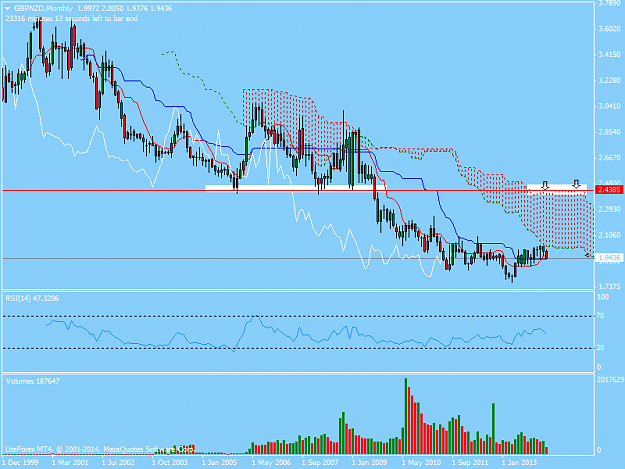
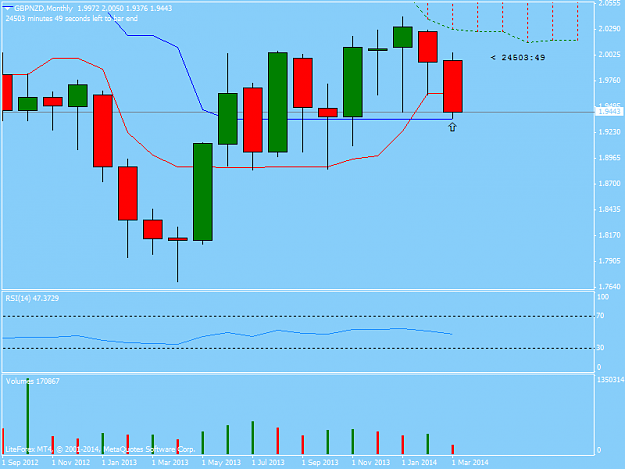
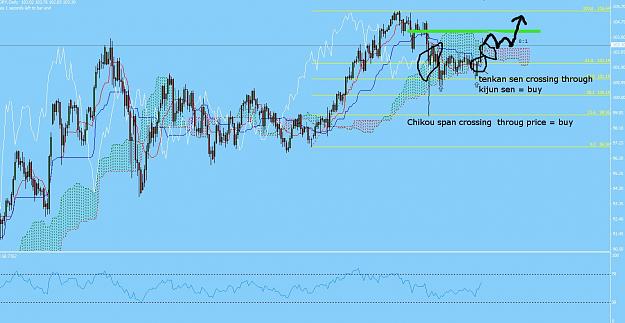
- peaches replied Mar 13, 2014
Monthly Kijun sen (blue line) is 1,9367. It´s the last line of defence for the young bulls. We need a monthly close above. There are weak buy signals in this ichimoku chart, (tenkan sen/kijun sen crossing and the chikou span might be going through ...
GBPNZD trading calls
- peaches replied Mar 8, 2014
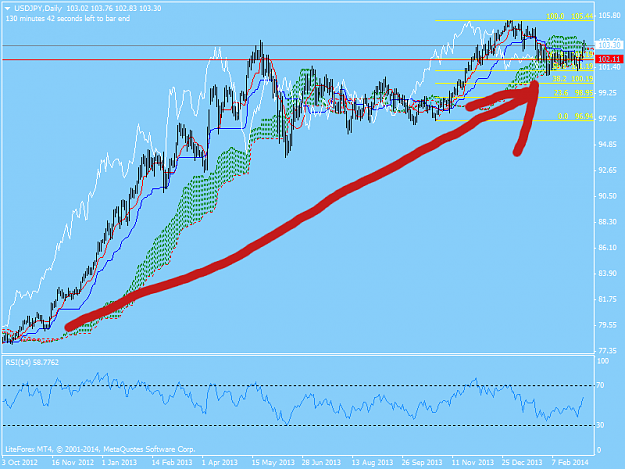
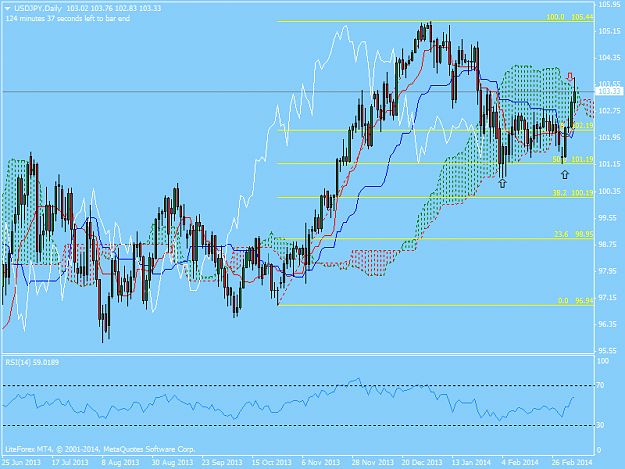
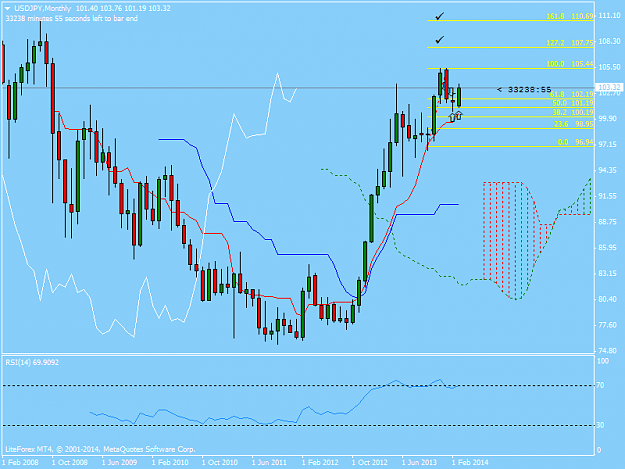
we have tested 101 2 times, I don´t think it will be tested a third time, but lets see ;-) one possibillity is in the chart. Up first to test 104, then drop back 2 times to test kumo cloud. Good entry point for late buyers. the usd has a bullish ...
USD/JPY Discussion
- peaches replied Mar 7, 2014
eliteincome, first identify the trend, second look for support and resistence third make a trading plan jump in in the direction of the trend... good luck :-)
USD/JPY Discussion
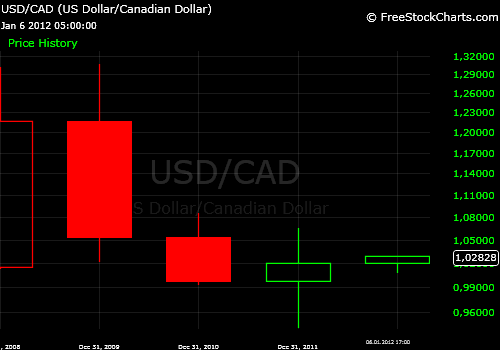
- peaches replied Jan 8, 2012
I hope everyone is fine, and I wish all traders a happy new year, a healthy living and success. I like to present some interisting yearly candles. Each candle means 1 year of trading. Some are indicision candles, with small or no body. This could ...
Daily candle chart


- peaches replied Dec 12, 2011
Daily candle chart yeah. Looks like we have entered a very long lasting down cycle. Slowly and for years. Hussin, give me a call from hawai, if the yen turns. Looks like it takes also years. I see geppy below parity. Slowly.
- peaches replied Nov 27, 2011
A gravestone doji. Haven´t seen one on the daily in my whole trading career. I just wanted to show one
Daily candle chart
- peaches replied Nov 27, 2011
1 Month later: I marked my entry in the second chart, so you can see price wen´t 200-300 pips against me, before it turned. I had to scale out some positions, to protect this special divergence account
Divergence Trading BUT, price turned, and I made pretty much ...
- peaches replied Nov 27, 2011
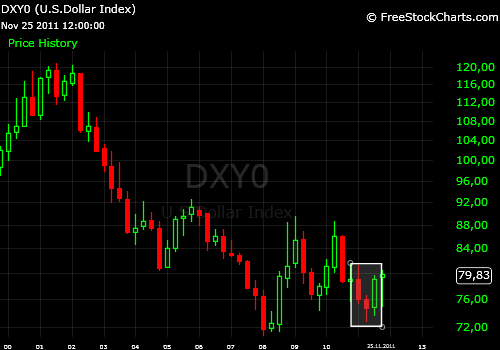
some monthly dollar index charts and kind of interpretation: On the monthly canldes you see big bear pressure for month may, june, july and august. But bulls hold the line, and reacted with massive bull power in september. September monthly candle ...
Daily candle chart


- peaches replied Nov 27, 2011
Harami from last thursday was not successfull, would not be surprised to see 1.39 by end of tuesday. But more resistance above. Eyes on 1.7150
Daily candle chart
- peaches replied Nov 22, 2011
here is a flip-a-coin situation. yesterdays daily candle (just closed) is a small doji. Of course it is a small doji, because it appears below a resistance area. I marked the area and the large candles in orange which broke through the area (blue). ...
Daily candle chart
- peaches replied Nov 21, 2011
lol...data failure from my platform, this is funny. But I think this gives direction for next weeks/month, with some pullbacks.
Daily candle chart
- peaches replied Nov 16, 2011
For eur/usd most importend is the long black candle for month september. The month before september where able to keep price up (see long lower wicks), but september broke this support and closed below. Oktober candle was a fake. Price has to be ...
Daily candle chart
- peaches replied Nov 16, 2011
target for GU on monthly basis. Last month was for the traders who have been left up there to close theire positions. Market in most time is fair.
Daily candle chart