- Search Metals Mine
- 24 Results
- pakeha replied May 3, 2023
Buy#2 closed with +90 pips; Buy #1 is still in-progress with SL at BE; and Sell #1 activated. image
Level in Level out
- pakeha replied Mar 15, 2022
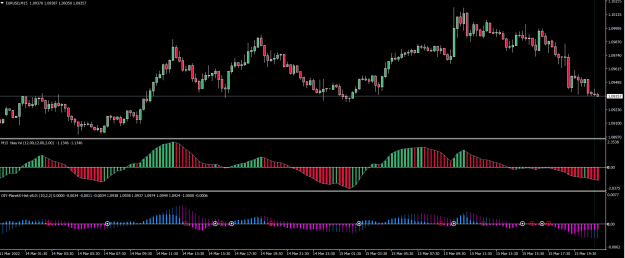
Thought I would change up the conversation a bit. I have been giving the latest histo version of PlanetX a spin and comparing it to an indicator that I usually have on my chart, the Blau TVI. They are pretty close if you ignore the circle signal on ...
PlanetX Indicator - can this indi be used for trading?
- pakeha replied Jan 26, 2022
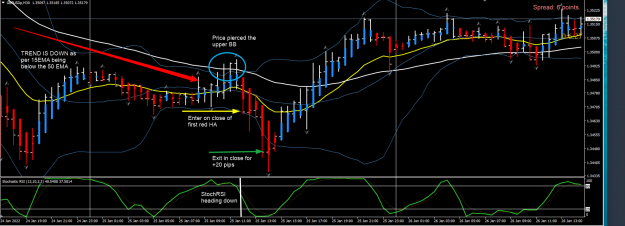
I have attached an example of a GBPUSD trade, as I interpret the instructions. If you take a pair and backtest it visually you will see how it works. A lot of times the piercing of the BB edge will come during a narrowing of the bands (Asian ...
Trend Cycle Entry
- pakeha replied Oct 30, 2021
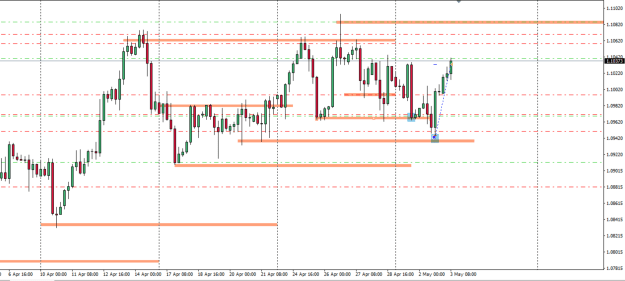
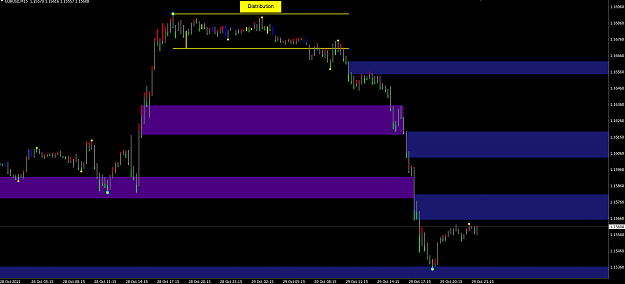
The chart below is my current analysis of the EURUSD. The Distribution zone (yellow) may also be called rotation, consolidation, range or equilibrium. I happen to prefer the Wyckoff terminology, but that is just me. On the chart the purple zones are ...
Bionic Chart - The easiest forex navigation
- pakeha replied Oct 30, 2021
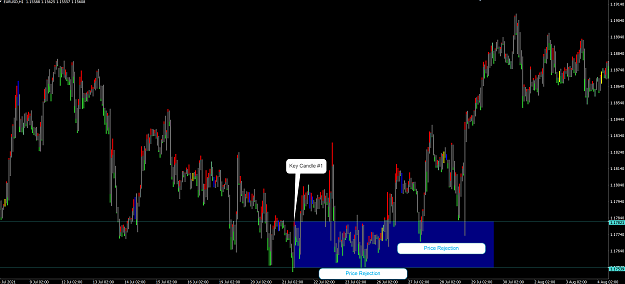
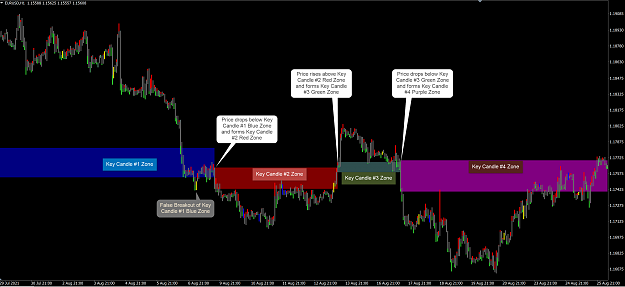
Determining Key Candles From the first 1:20 of the video on post #286 (Work With Bionic Candle) I have constructed 2 charts on the H1 EURUSD showing how to determine a Key Candle and the associated Key Candle Zones. Chart 1 attached shows a "strong" ...
Bionic Chart - The easiest forex navigation
- pakeha replied Feb 14, 2021
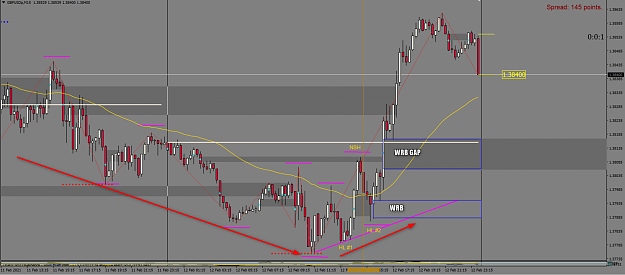
Here is an example from my Friday trading. I trade GBPUSD around the US open - the vertical brown line is when I start looking at charts. Here is what I saw: 1. Preceding market structure showed a down-trend (LH/LL). At around 14:00 on my chart (7 ...
(binned per thread starter’s request) Supply and Demand, Price
- pakeha replied Dec 20, 2019
Like some of you guys, I did Jarratt's course a few years back and it definitely expanded my knowledge and appreciation of what it takes to be a successful trader. After watching him in the early days I never considered Jarratt to be a great trader. ...
Is this guy trustworthy?
- pakeha replied May 13, 2019
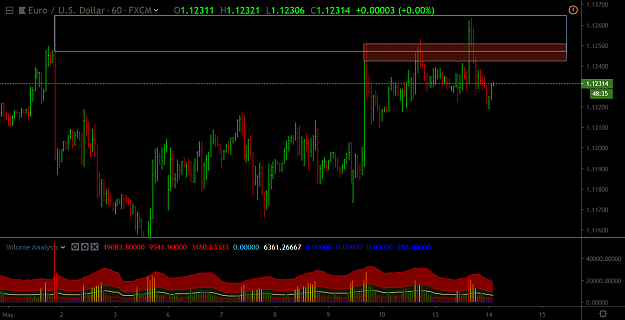
Naviafra I was looking at the chart on post 30 and noticed that the supply area you designated is actually part of a bigger supply zone from May 1. This helps explain why the price went above the supply zone on your chart on May 13. See the chart ...
Volume Leads Price - VSA and Wyckoff
- pakeha replied Jan 12, 2019
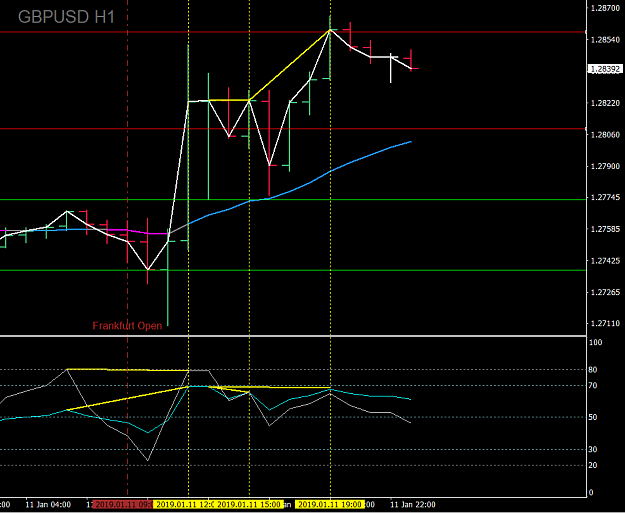
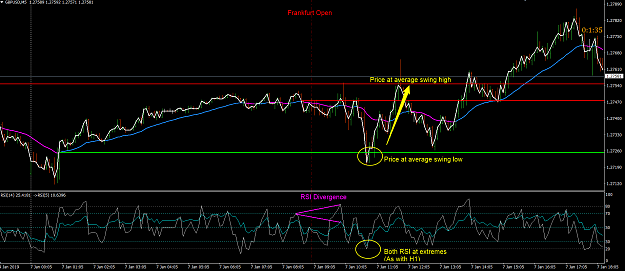
Allan, I am struggling to see the Hidden Divergence on the H1 at 2. On my chart it is actually a regular divergence - higher close price by less than 1 pip and lower RSI value.
Trading the Cable swings via averages
- pakeha replied Jan 7, 2019
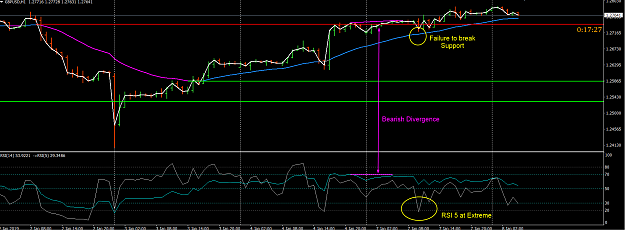
Guys My understanding is that there are 2 types of signals to look for on the H1 prior to the Frankfurt Open 1. Momentum (RSI) at Extremes (no divergence) 2. Divergence at Momentum (RSI) Extremes - primarily price/RSI and RSI/RSI divergence. There ...
Trading the Cable swings via averages
- pakeha replied Dec 13, 2018
I was looking at the bullish divergence Alan. But as you say wait until opening time.
Trading the Cable swings via averages
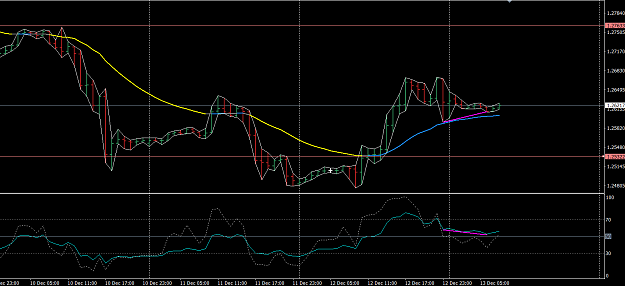
- pakeha replied Nov 1, 2018
Bionics Thanks for the update. Happy to say I took the trade just prior to yesterday's NY Close. For me there were three things that I liked (confluence): 1. price was in a good demand zone from which there was a 500+ pip reversal in August, so I ...
The Equilibrium, a key to success!
- pakeha replied Oct 25, 2018
Bionics I really like the "event driven" S/R concept that you have put forward here. The use of WRBs within a significant market trend. As I look at how you have drawn the S/R zones I notice that there are different methods in use. Attached is a ...
The Equilibrium, a key to success!
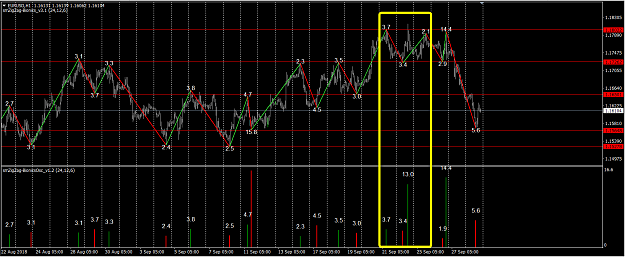
- pakeha replied Sep 28, 2018
Bionics Nice thread. I downloaded the indicators and placed them on a EURUSD H1 chart. I did notice a difference between them re: how the zigzag painted on the main chart vs indicator window 1. See the yellow rectangle in the attached a screen shot. ...
The Equilibrium, a key to success!
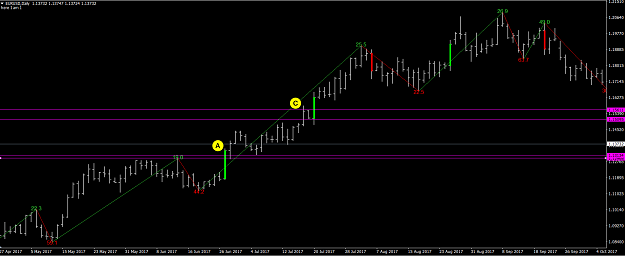
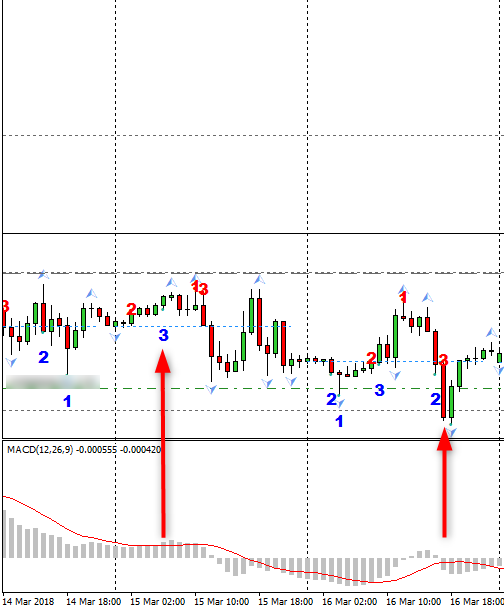
- pakeha replied Mar 31, 2018
Here is an example on GBPUSD H1 March 16, plus another on March 15 - admittedly they are the exception. Seem to occur in really tightly ranging markets.
Swing x1, x2, x3 Strategy by Kelvin
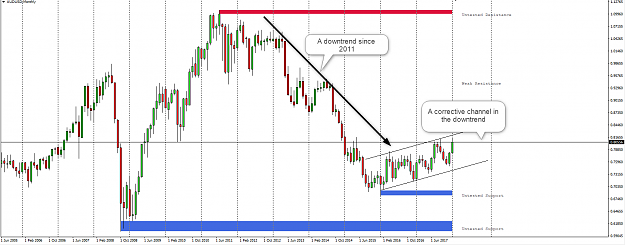
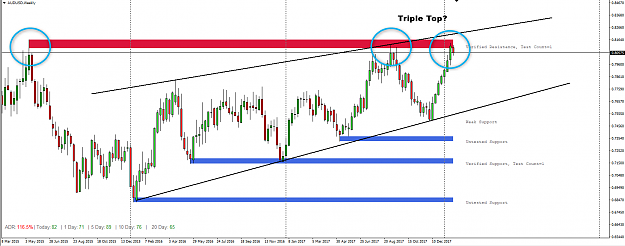
- pakeha replied Jan 31, 2018
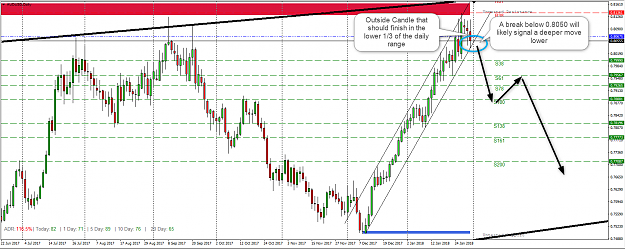
Here is my technical take on the Aussie (I am in it as well). I apologize for the template, but just wanted to make the analysis clearer on monthly, weekly and daily charts as context for Davits method. Monthly - basically a corrective move in a ...
Pivot Trading
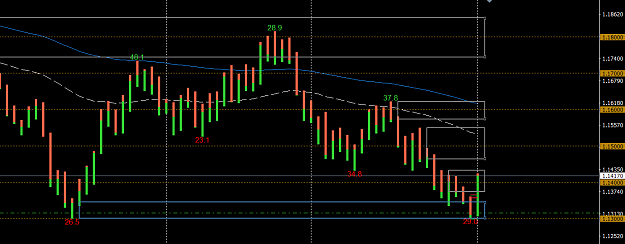
- pakeha replied Jan 14, 2018
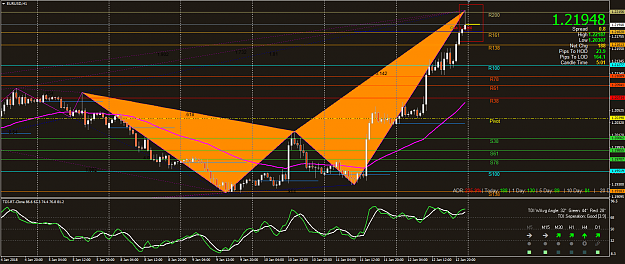
Have been playing around with ZUP and noticed this on the EURUSD H1. For the harmonics guys in the group, how would you trade this - a breakout below R138?
Pivot Trading
- pakeha replied Jan 11, 2018
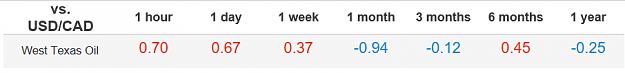
...... back to OIL
Pivot Trading The Oanda Correlation Chart of West Texas Oil and the USDCAD shows that during the last 12 months the negative correlation (Oil goes up and USDCAD goes down) hasn't been very relevant. However, the last month has shown ...
- pakeha replied Jun 5, 2017
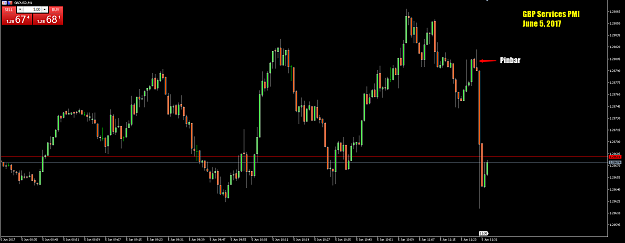
UK Services PMI. There goes that 1 min pin bar again!. There was another one at the 5 min candle prior to the news as well (my first signal).
News trading discussion - continuation
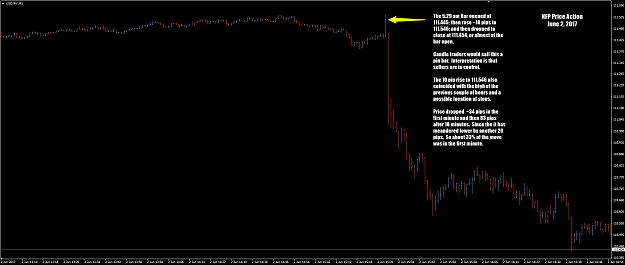
- pakeha replied Jun 2, 2017
Thought I would post something slightly different this time - the anatomy of the NFP price action today - in particular the minute prior to the news release. In looking at a number of past red news events I have seen this particular price action ...
News trading discussion - continuation