- Search Metals Mine
- 11 Results
-
 nc_trader replied Aug 19, 2014
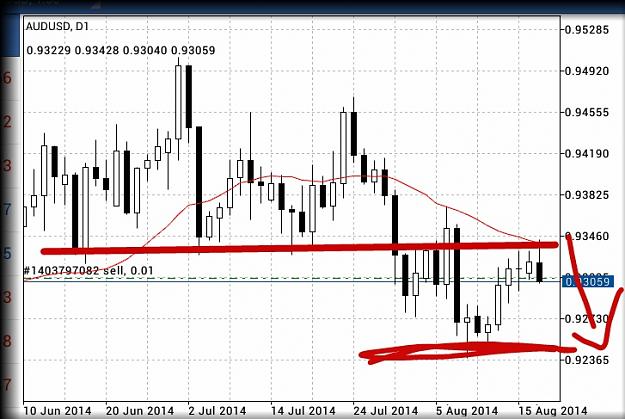
Anyone looking to aud/usd?? It is making higher lows and lower Heights. And today it made an ugly bearish engulfing candle. Sorry for this ugly chart. Made it on tablet.
james16 Chart Thread
- nc_trader replied Aug 7, 2014
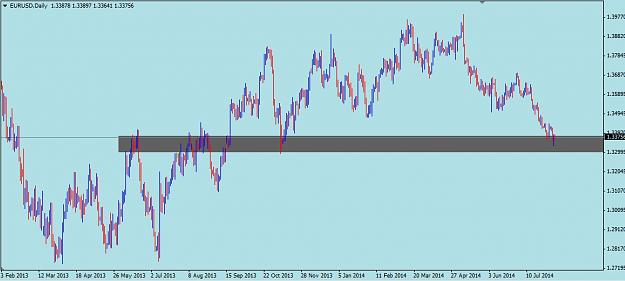
I think EUR/USD is at a key support level But this chart is not very clean, the support zone is not very clear.
james16 Chart Thread
- nc_trader replied Apr 22, 2013
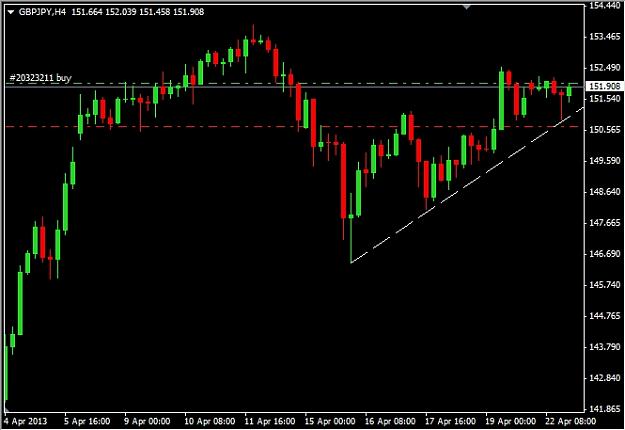
I'm long in GBP/JPY Bullish pin bar. It confluences also with a nice trend line. I think this is a very nice setup. The last weekly candle also shows a nice bullish pin bar
james16 Chart Thread
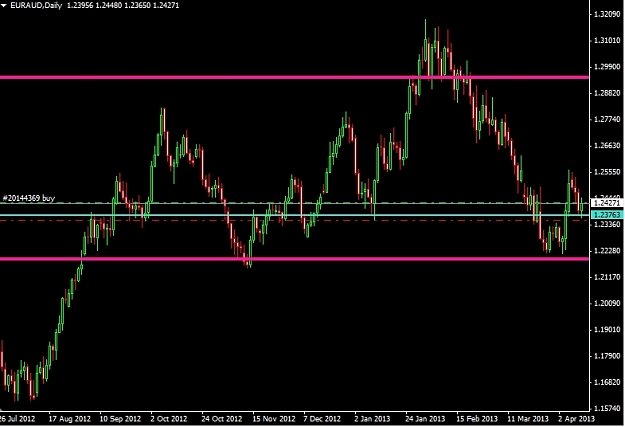
- nc_trader replied Apr 11, 2013
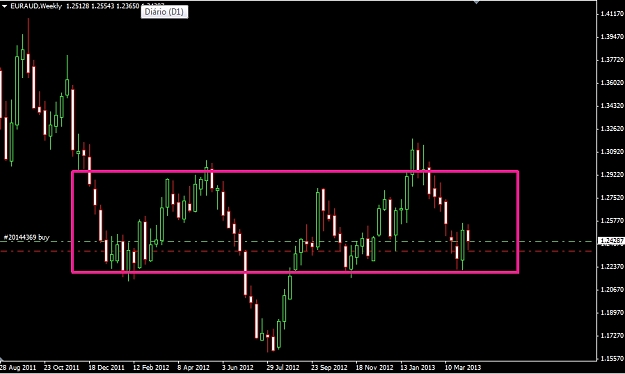
I'm long on eur/aud. On weeakly chart we can see that price is trading in a nice box. Anda last week price formed a nice bullish engufling cnadle. And on daily chart price tested a very importante suport and form a bullish candle on it. I think ...
james16 Chart Thread
- nc_trader replied Apr 9, 2013
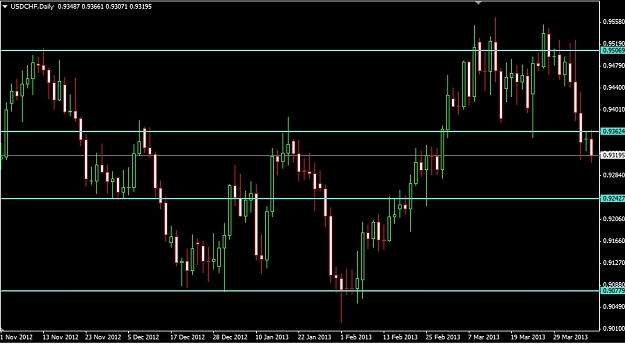
Aud/jpy that i posted is working nice ! I'm also looking to the USD/CHF daily. It seems it will form a Fakey Setup. This is my chart.
james16 Chart Thread
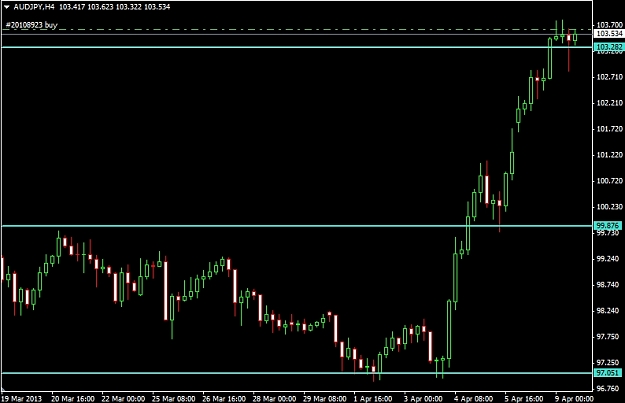
- nc_trader replied Apr 9, 2013
I'm long on aud/jpy. We have a very strong uptred. And at 4h chart we can see a nice Bullish Pin Bar
james16 Chart Thread
- nc_trader replied Apr 4, 2013
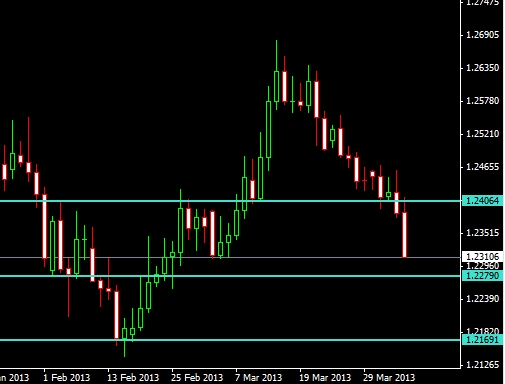
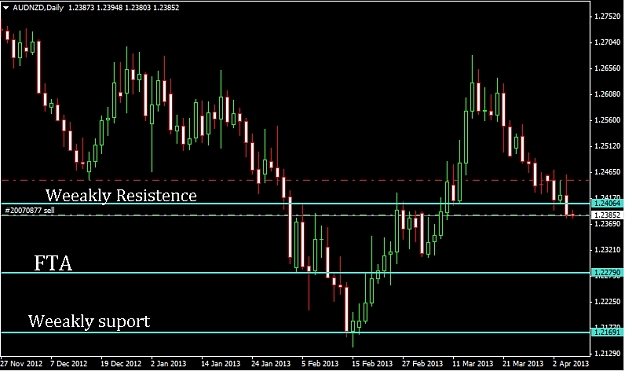
I'm Short on AUD/NZD In last weeks we have a strong bearish trend. Today price breaks an importante suport level, and formed a bearish engufling bar, and also a fakey setup! And in yesterday we can see a inside bar that is a nice signal that the ...
james16 Chart Thread
- nc_trader replied Aug 23, 2012
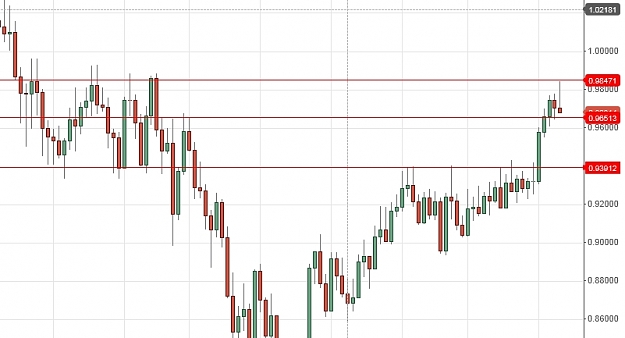
Hi. You have a strong resistence level very very close! Look to this weeakly chart
james16 Chart Thread
- nc_trader replied Aug 22, 2012
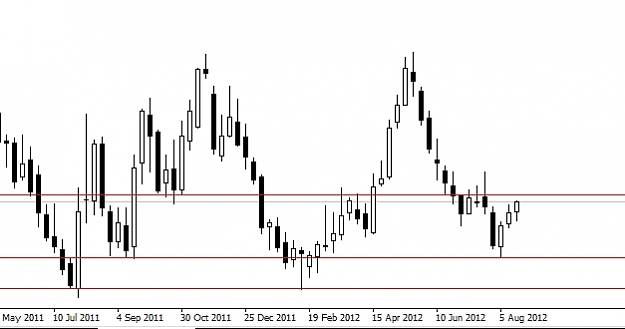
You are trading directly to a weeakly suport zone! I only go short when prices break this suport zone. Look to this weeakly chart, you can see a perfect suport zone.
james16 Chart Thread
- nc_trader replied Aug 22, 2012
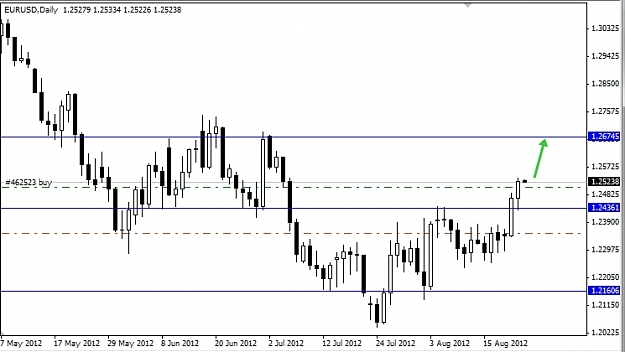
I'm long at eur/usd It breaks a very important resitence level. I think it will go up to next resistence level in next days. Daily chart
james16 Chart Thread
- Posts by Member Search: 'nc_trader'