- Search Metals Mine
- 7 Results
-
 nanohedge replied Jun 29, 2016
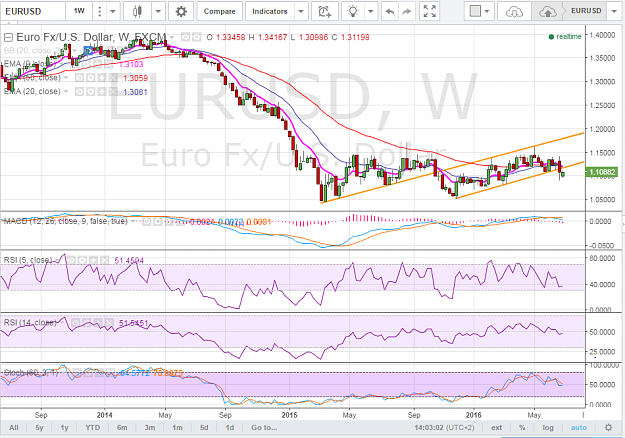
Weekly chart of EURUSD - I see some more upside short term, perhaps a retest of the broken trendline, but ultimately a long-term decline. Comments welcome! image
mingle-mangle
- nanohedge replied May 24, 2016
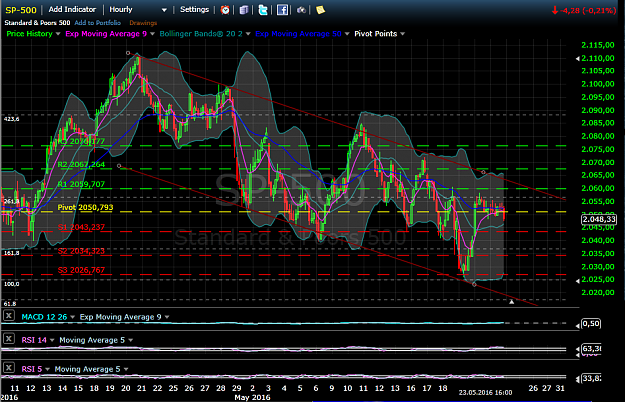
... and 10.000 hit At these levels SPX would open around 2060, very close to the upper trendline on the hourly chart: image
Carpe diem: Intraday tactics for Dax and Dow
- nanohedge replied May 4, 2016
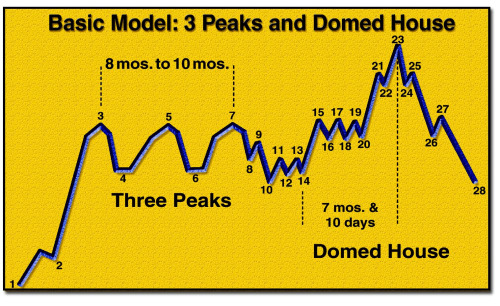
Hi FXcube, Essentialy a "3 Peaks and a domed house" pattern, I would think... image
Carpe diem: Intraday tactics for Dax and Dow
- nanohedge replied Apr 27, 2016
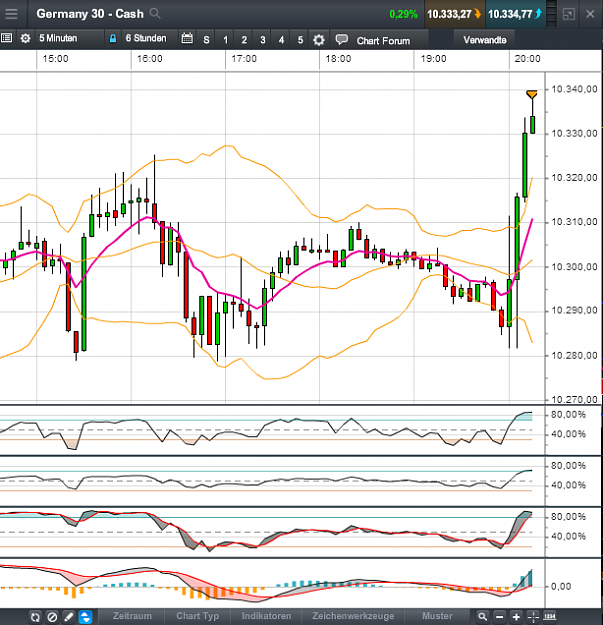
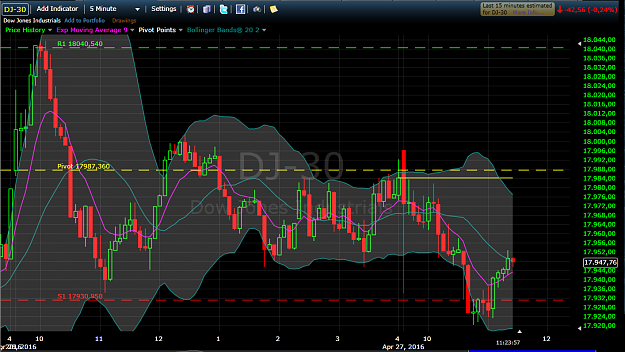
FXC, I agree, DAX very extended from the 9 EMA and way above the upper BB on 5 and 15 min time frame. Short at 10'337 (again, all my feeds give me prices that seem to be approx. 10 points lower than yours). image
Carpe diem: Intraday tactics for Dax and Dow
- nanohedge replied Apr 27, 2016
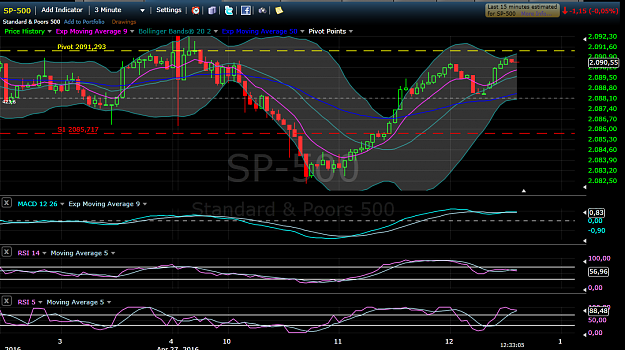
SPX 3 minute - some divergence on RSI, MACD, recycled to primary pivot. image
Carpe diem: Intraday tactics for Dax and Dow
- nanohedge replied Apr 27, 2016
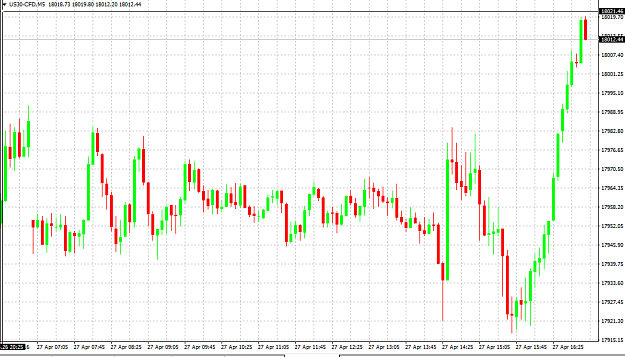
Thanks FXcube. Interesting, though, as my (demo version) MT4 gives me a low of approx. 17917, and my CFD broker's feed is similar (CMC Markets): image image
Carpe diem: Intraday tactics for Dax and Dow
- nanohedge replied Apr 27, 2016
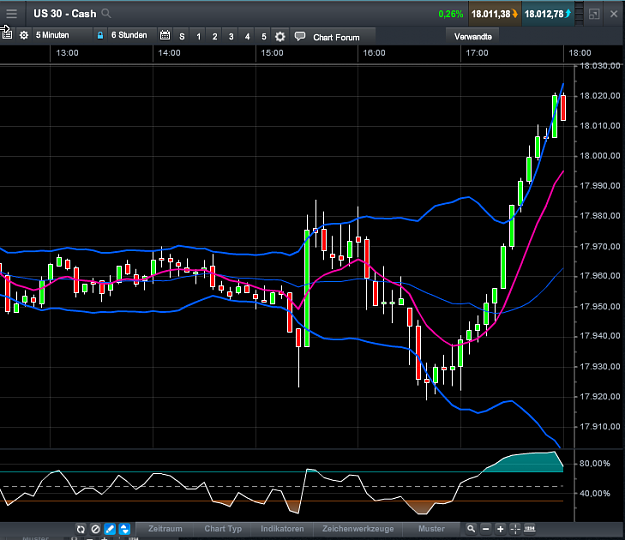
Hi FXcube, just out of interest, which US30 instrument are you trading? I assume it must be derived from a futures contract, as the cash price was never close to 17'900 today (see attached chart). Best regards, nanohedge image
Carpe diem: Intraday tactics for Dax and Dow
- Posts by Member Search: 'nanohedge'