- Search Metals Mine
- 22 Results
- misterboy replied Sep 22, 2011
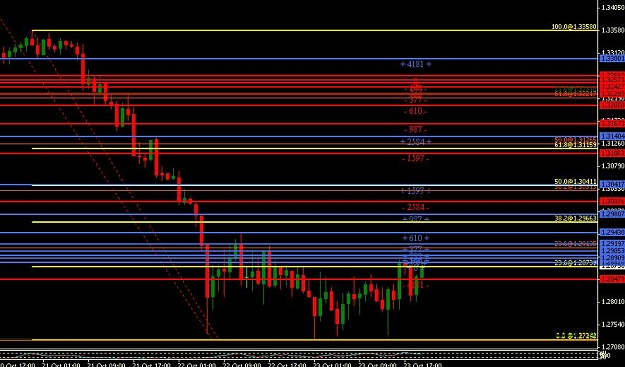
Hey, I have the following levels marked currently where price has not been. Let me know what you think.
Supply and Demand trading with Fibs
- misterboy replied Sep 22, 2011
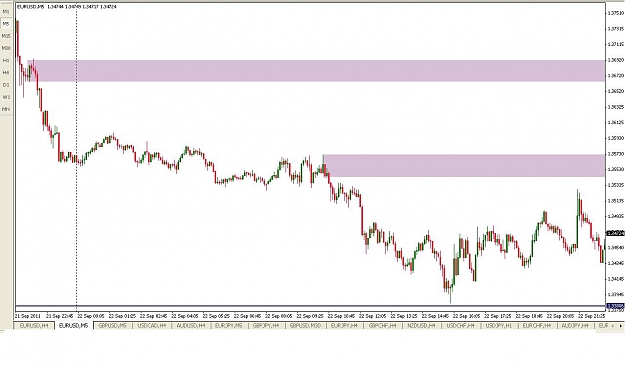
Hey Dean What are your thoughts on this one?
Supply and Demand trading with Fibs
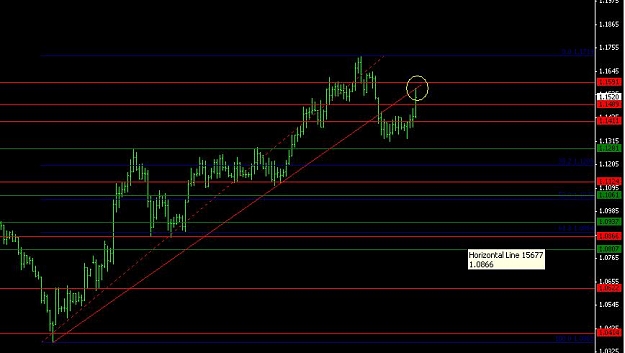
- misterboy replied Sep 1, 2011
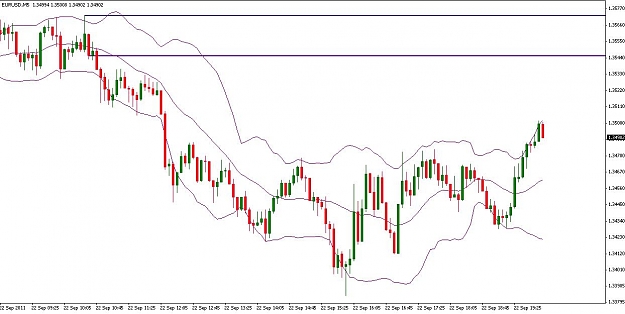
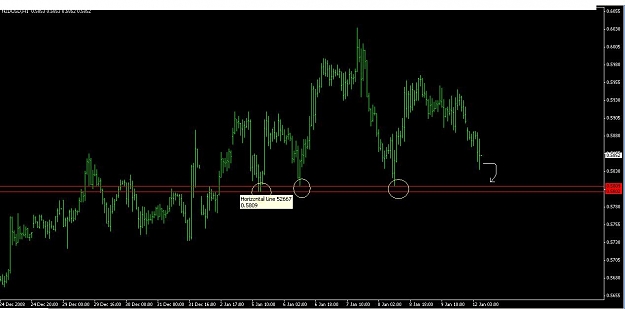
Open Price Horizontal Line — Does anyone know of an indicator that draws a horizontal line at the open price of the day? I want to be able to see the lines of past days as well. As an example, I have drawn lines manually for the past 2 days to ...
I will code your EAs and Indicators for no charge
- misterboy replied Jul 5, 2011
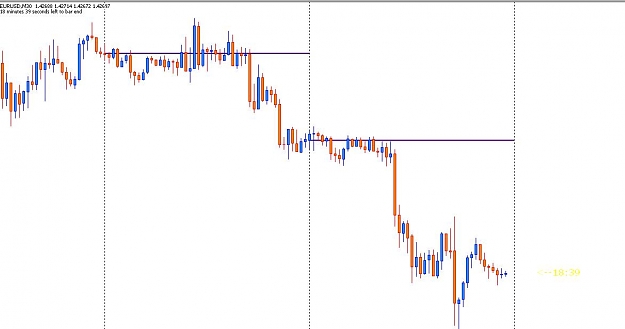
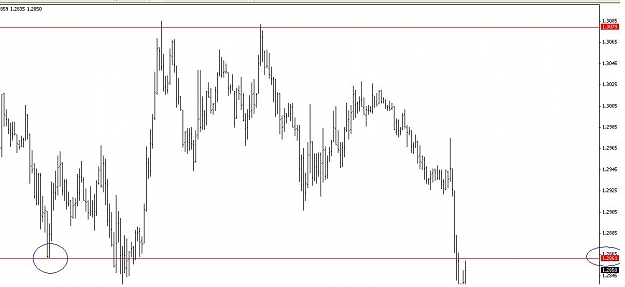
It'd be interesting to see what happens if and when it gets up to this level: about 1.2210 area.
Trading Currency Futures using Sam Seiden Supply & Demand levels
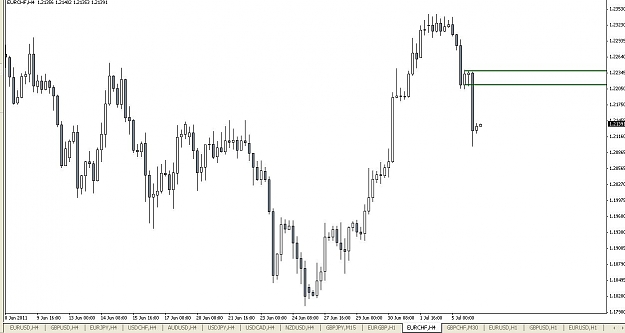
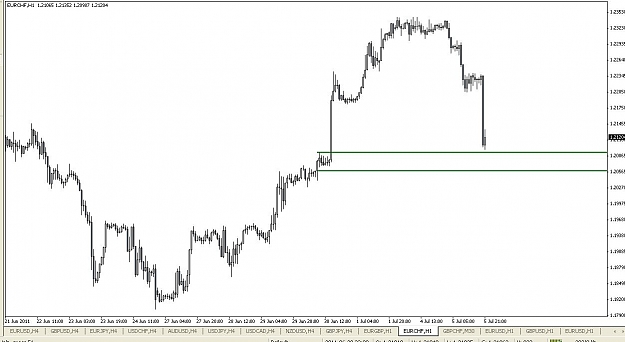
- misterboy replied Jul 5, 2011
Potential setup — Here's the chart: 1 hour EURCHF
Trading Currency Futures using Sam Seiden Supply & Demand levels
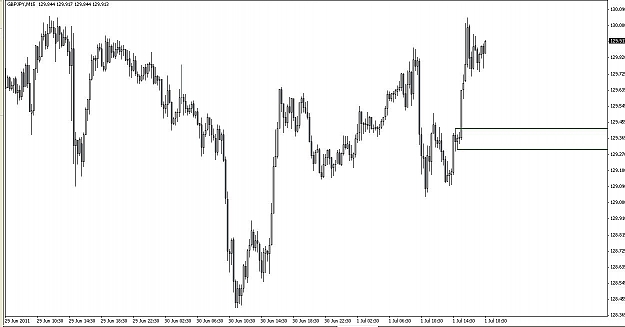
- misterboy replied Jul 1, 2011
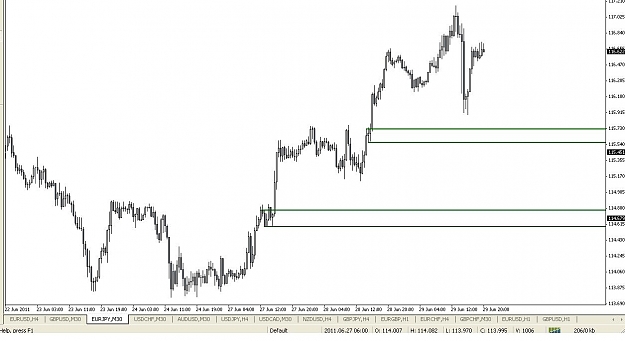
Potential GBPJPY demand area:
Trading Currency Futures using Sam Seiden Supply & Demand levels
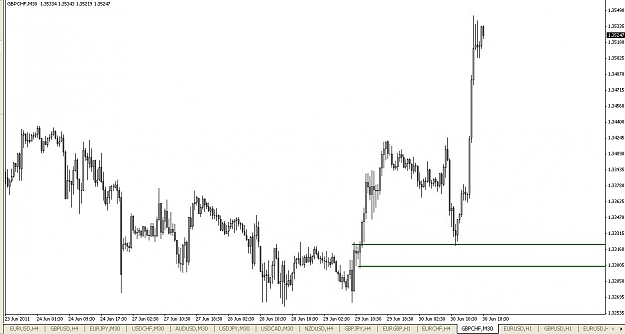
- misterboy replied Jun 30, 2011
I drew this one some time back, turned out great. Just posting it so everyone can see.
Trading Currency Futures using Sam Seiden Supply & Demand levels
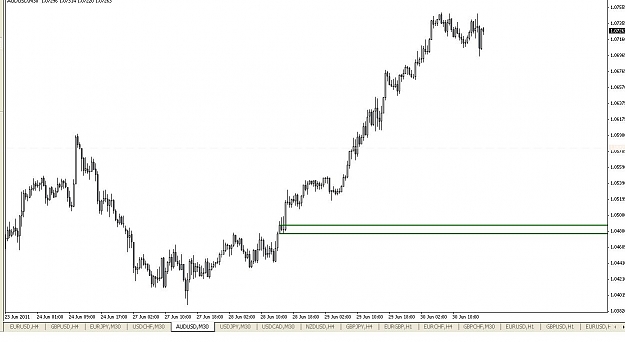
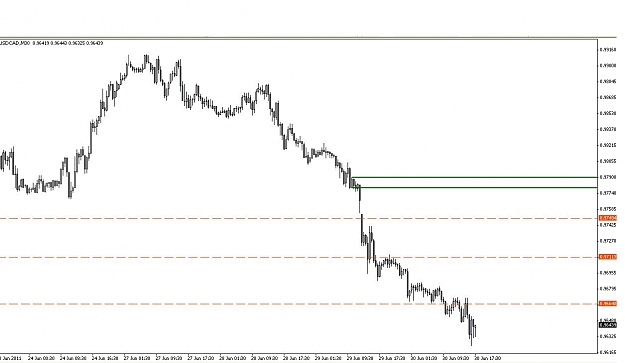
- misterboy replied Jun 30, 2011
Here I am going to post a few lines I have on some of the other charts. Lets see how it goes: Ignore some of those horizontal dotted lines
Trading Currency Futures using Sam Seiden Supply & Demand levels
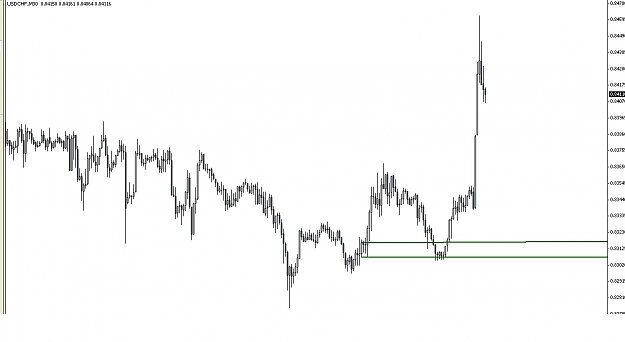
- misterboy replied Jun 30, 2011
This UC level in hindsight ofcourse, was great. Should have posted it earlier before it happened though. BTW, Dean I found the same with me. Going back to test, I find my accuracy a little low . But looks like I may be improving a bit.
Trading Currency Futures using Sam Seiden Supply & Demand levels
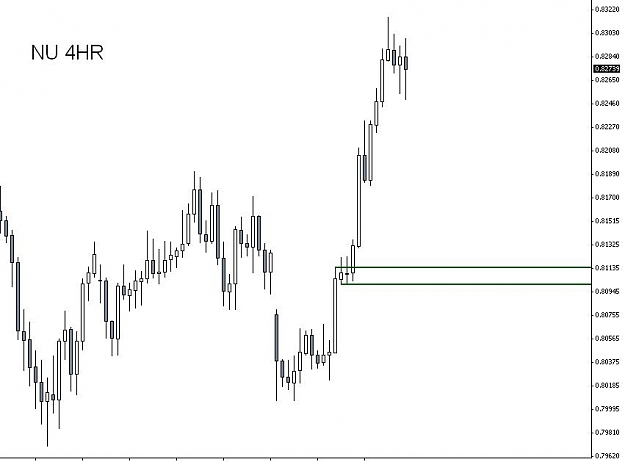
- misterboy replied Jun 29, 2011
How do these look guys?
Trading Currency Futures using Sam Seiden Supply & Demand levels
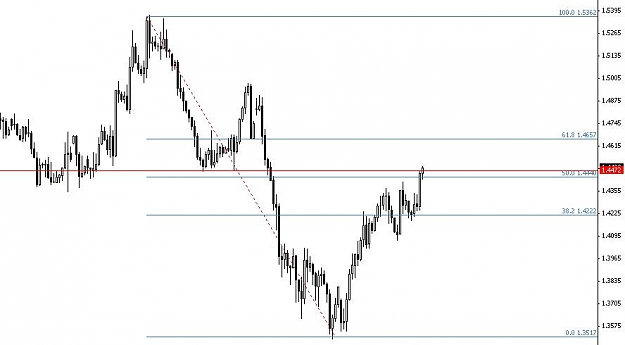
- misterboy replied Jan 31, 2009
GBPUSD's really close to 50% and also previous support. I think I'll be watching it tomorrow.
No Brainer Trades
- misterboy replied Jan 28, 2009
Me too but look at this one: previous up trend line now as resistance:
No Brainer Trades
- misterboy replied Jan 23, 2009
This is the one Im talking about...this is 15min beause its a bit clearer to see
No Brainer Trades
- misterboy replied Jan 14, 2009
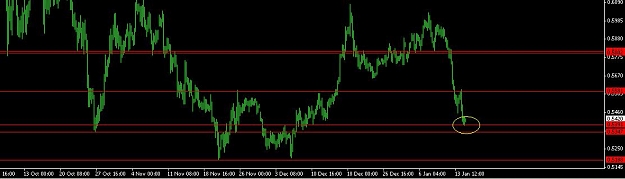
nzd/usd — Anyone planning to sell the break of this level?
No Brainer Trades price has been around there for ages
- misterboy replied Jan 12, 2009
Hey Anyone taking note of this? Would this be a no brainer, already been about 3 bounces off this level. Daily trend's down big time, so maybe a breakout??
No Brainer Trades
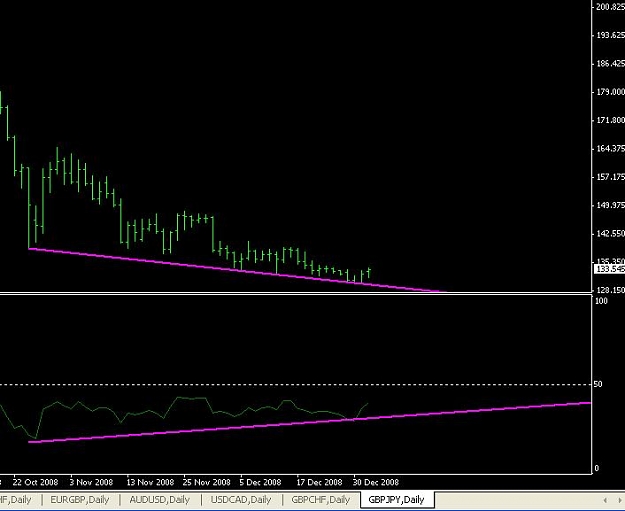
- misterboy replied Jan 2, 2009
Also, bullish RSI divergence on daily...
Auslanco - GBP/JPY and GBP/USD (newstrade)
- misterboy replied Dec 26, 2008
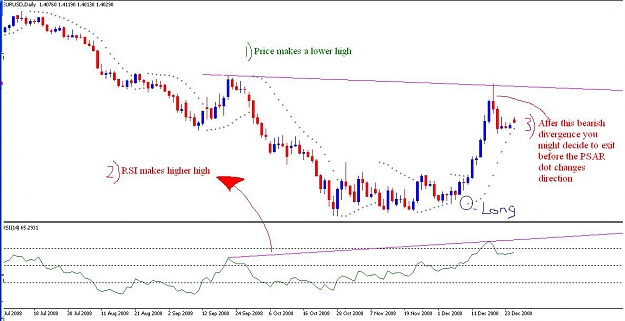
Sure. I'm not sure if I missed something or not so, I am going to assume you use PSAR to exit as well. Here, I am going to post a very recent example of EUR/USD where there was RSI divergence but PSAR had not given us a signal to exit the ...
Shakesfx GBP/ JPY Parabolic SAR. Nothing more, nothing less
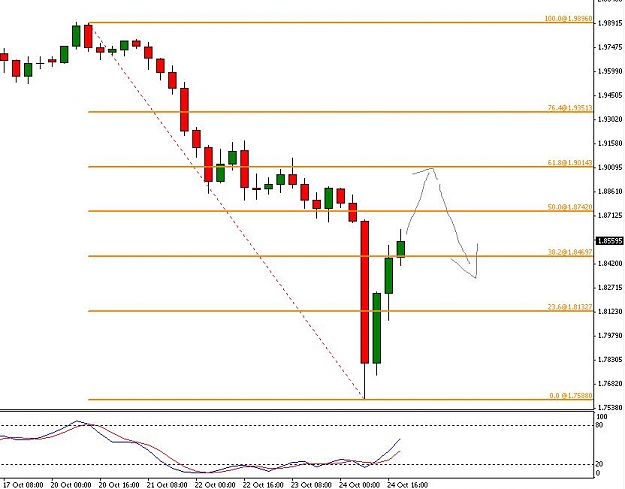
- misterboy replied Nov 11, 2008
This is how I trade fib levels...I only trade it if its at 50% or 61.8%...(I am still demo trading btw)...and I use stochastics to confirm. I'll post an example..I am posting an old chart I saved some time ago because I already have it on my ...
Fibonacci Trading with Bobokus
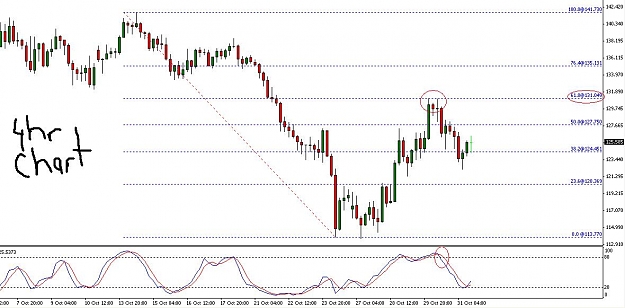
- misterboy replied Oct 25, 2008
take a look...tell me if its a good potential setup — Hey, I was looking at this chart of GBPCHF and there could be a short opportunity: This is a 4 hour chart
Fibonacci Trading with Bobokus
- misterboy replied Oct 23, 2008
Fib Indicator — Heres what my chart looks like after adding the indicator. It looks very messy, is this normal? Or am I doing something wrong? Thanks
Trading Fib Zones