- Search Metals Mine
- 26 Results

-
 mattkirby replied Apr 11, 2017
but with the calculation with kprsa's Pivot indi I get other S/R lines/numbers like with your original one (pic 1 & 2) image image
Random Walk (The unbeatable!)
- mattkirby replied Feb 26, 2015
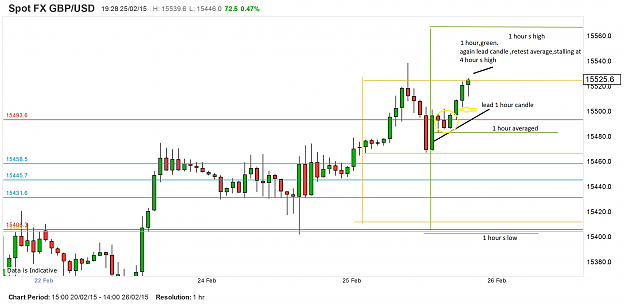
Thanks for your answer diceman, 2 more questions........how do you calculate the highs and lows? Is it a fib Extension or a kind of Pivot Point calculation? Or is it your secret? Why have you choose this candle and not the one I marked with the ...
Scalp, scalp, scalp
- mattkirby replied Feb 12, 2015
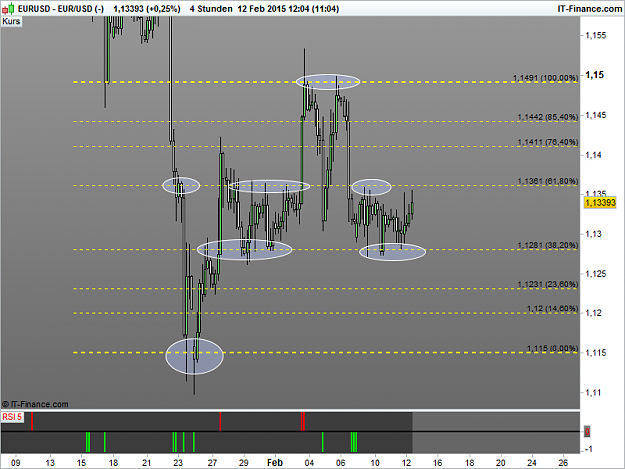
One more from me.... If I understand that "concept" right, there is one big area where to draw the fibs. For eur/usd this area is 1.115 to 1.3480 Then we draw fibs inside that fib areas to see the smaller timeframe moves......... I did this and draw ...
Using WM/Reuters Benchmark Rates in trading
- mattkirby replied Jan 21, 2015
Hello Dadas, I'm a long time observer of this great thread. Many thanks for sharing your thoughts and indicators here. I have some questions about your latest indis and how you use it. I put your secret weapon script to the Chart where the last ...
Price Action in Day Trading by Dadas
- mattkirby replied Oct 14, 2014
Hi guys, Long time ago since I posted here last time..... At the Moment I try to figure out how I can use the TZ zones in a meaningful way for me. But I stumple with my tries till now. In the Chart below I got 2 zones which are not finished yet. One ...
The similarity system
![Click to Enlarge
Name: [dax30]m5.png
Size: 54 KB](/attachment/image/1528200/thumbnail?d=1413292493)
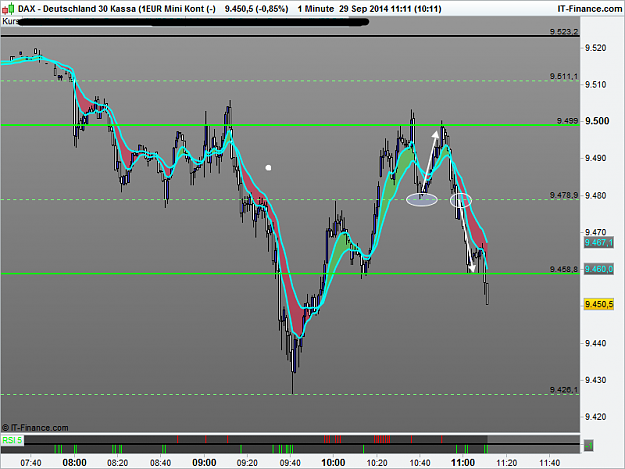
- mattkirby replied Sep 29, 2014
2 nice 20 Point moves from this Point to visit important Price Points above / below.......... image
Carpe diem: Intraday tactics for Dax and Dow
- mattkirby replied Sep 18, 2014
take a look at the D1. Perfect 50 Fib retracement. didn't recognize this the last days. very stupid from me
SPX and DAX - CFDs are the place to be
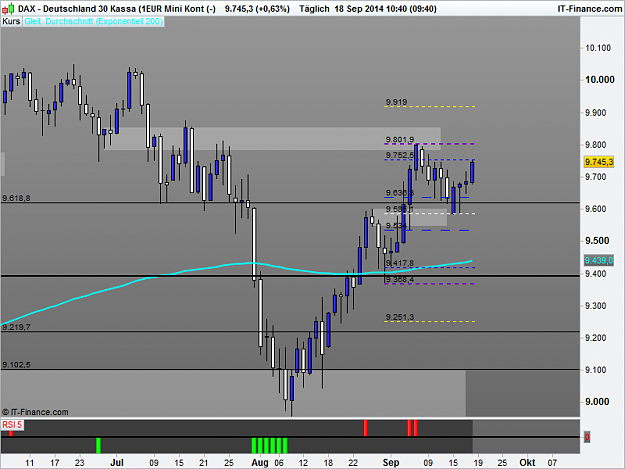
 . Now first target at 9752 is reached. For me now 2 posibilities. Retrace to 9636 (38 Fibo) or more up to 9801 and then 9919. Let's ...
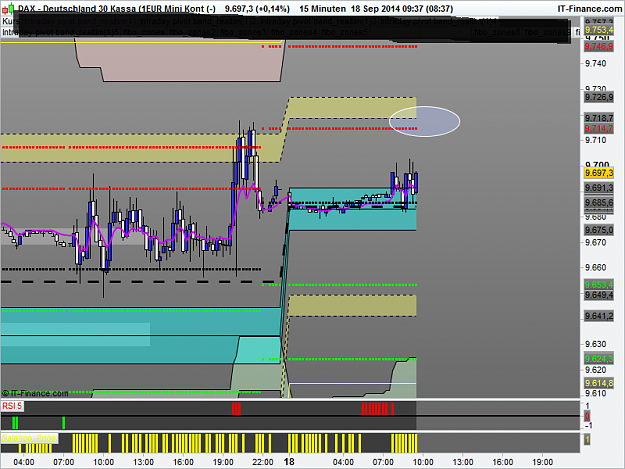
- mattkirby replied Sep 18, 2014
Good morning. It's difficult today to find a direction for Dax. I wait to find a short possibility. Perhaps in the circle area. image
SPX and DAX - CFDs are the place to be
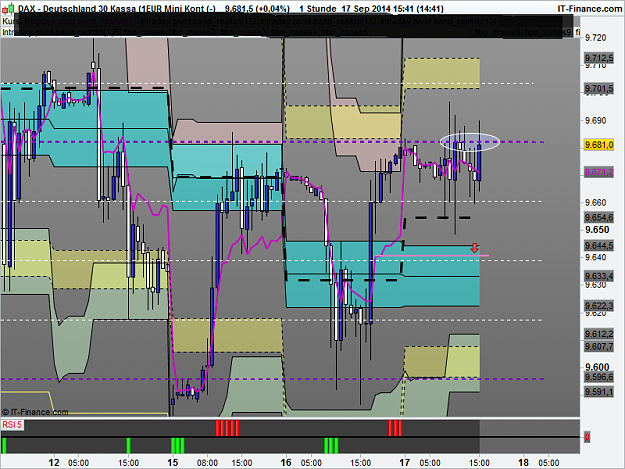
- mattkirby replied Sep 17, 2014
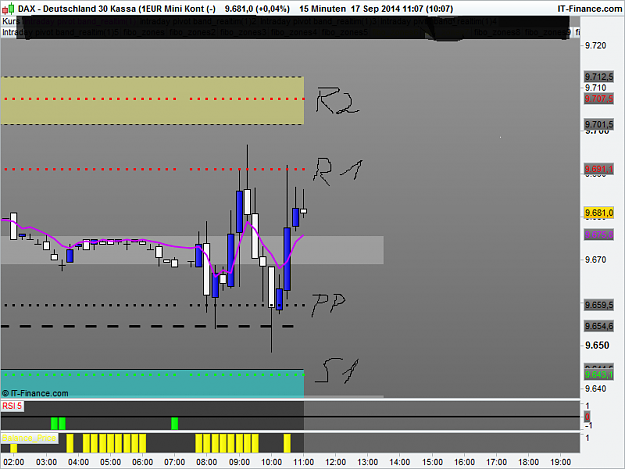
Dax needs a close on the 1H Chart over 9682 to get to higher prices. image
SPX and DAX - CFDs are the place to be
- mattkirby replied Sep 17, 2014
...and thats how it looks like: image
SPX and DAX - CFDs are the place to be
- mattkirby replied Sep 17, 2014
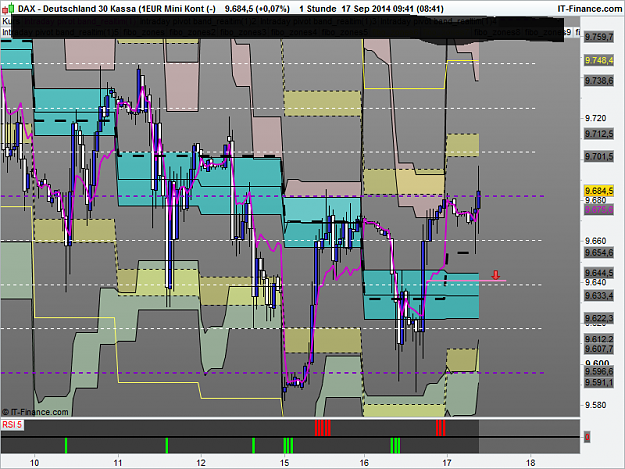
Good morning all, I'm new here in this thread. I trade the dax since 2 years now and I'm happy that I finally found a threat here on FF for it. Red arrow is where Price should go during the day. just my opinion! image
SPX and DAX - CFDs are the place to be
- mattkirby replied Sep 12, 2014
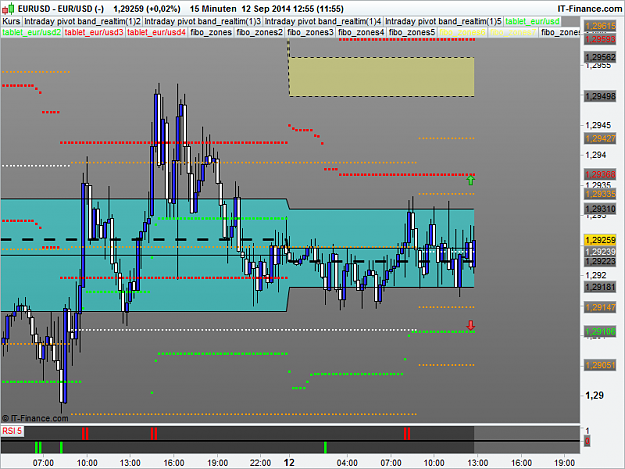
seems like eur/usd is prisoned in todays Fib-zone (Aqua). Time for us open and News to get some moves....... image
The similarity system
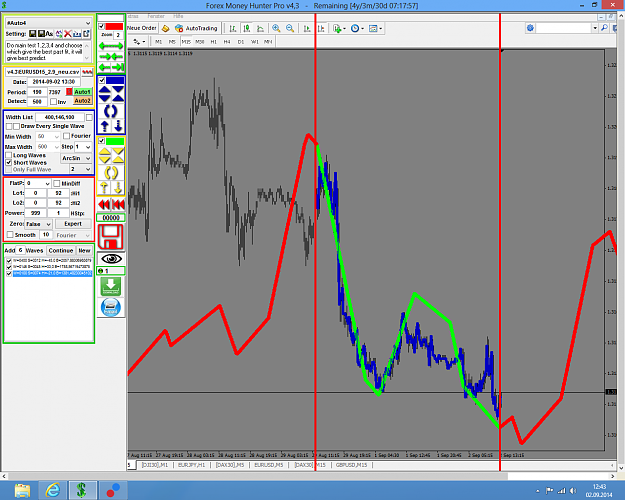
- mattkirby replied Sep 2, 2014
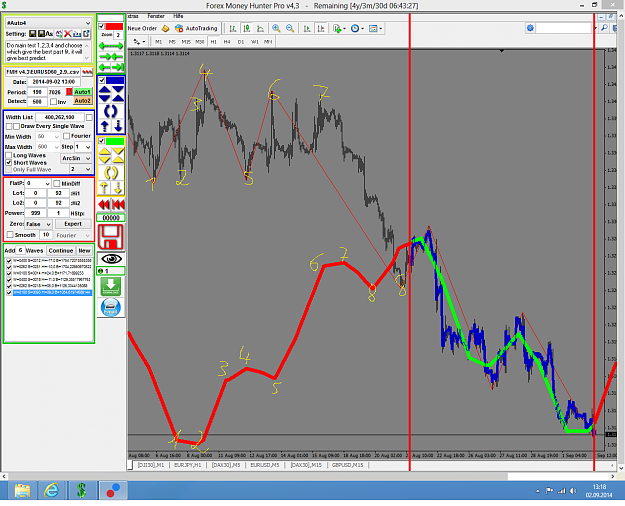
Here eurusd 1H Chart. Look the proportions of the wave are not equal with the Price moves. But wave direction Change and Price direction is hitting well. Just an Observation........ image
Every Day, We Will Know Tomorrow's Prices!!
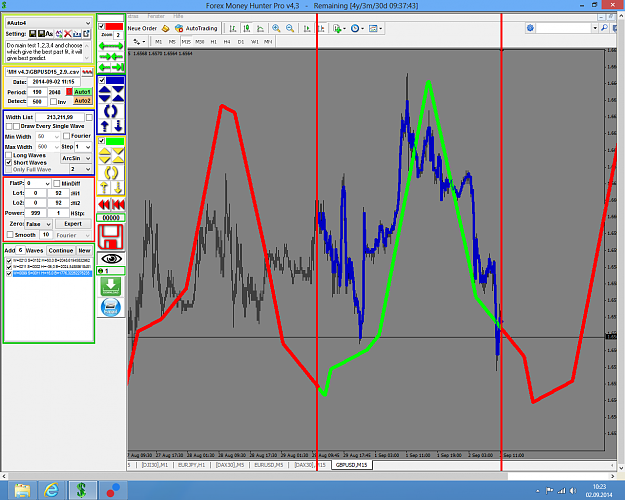
- mattkirby replied Sep 2, 2014
Updated look for eurusd 15min. Looks like the top is sliding to tomorrow....and first reaching the Zone around 1.31. image
Every Day, We Will Know Tomorrow's Prices!!
- mattkirby replied Sep 2, 2014
Here you go. Bottom seems to be around 17.00 London time. But be careful the prediction on the left isn't working good so this one could be also not working! image
Every Day, We Will Know Tomorrow's Prices!!
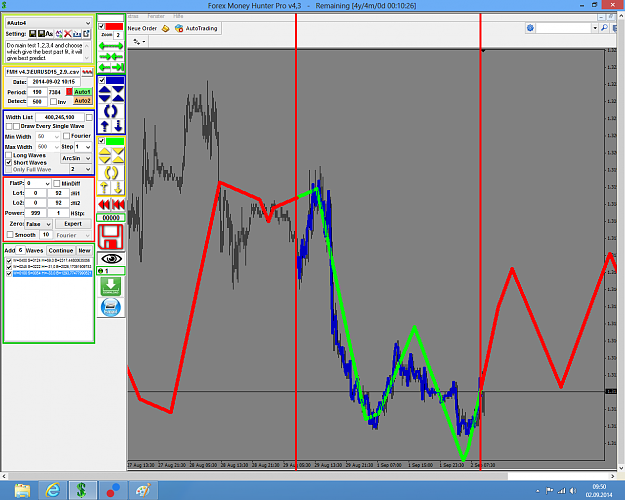
- mattkirby replied Sep 2, 2014
Here is my wave forecast for Eurusd 15min chart for next 24 hours. first top = around 16.00 London time first bottom = around 04.00 London Time image
Every Day, We Will Know Tomorrow's Prices!!
- mattkirby replied Jul 16, 2014
Hi, I`m a lurker to eurusdd threads and ideas for long time. And also from things happened out of this..... now for me it`s very funny that someone seems to have some similiar ideas or thoughts like have
A delicate secret Here my Chart.... image
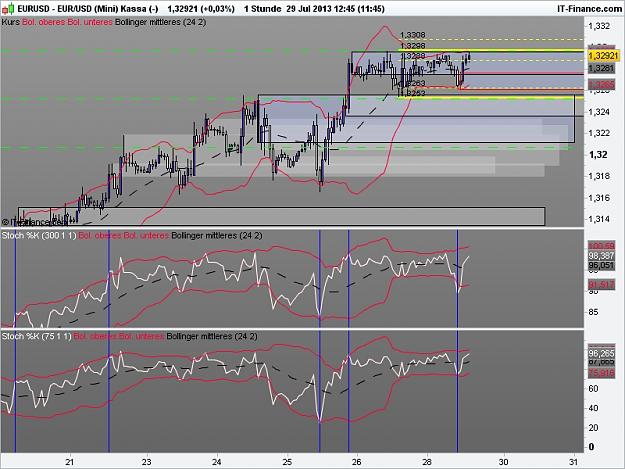
- mattkirby replied Jul 29, 2013
Perhaps we get some interesting zones by comparing two differe image nt stoch settings. One with the 300 settings and the other with the converted settings (here 75 for the 1H)
Similarity: A Practical Approach