- Search Metals Mine
- 55 Results (2 Threads , 53 Replies )
-
 kenmania replied Apr 23, 2009
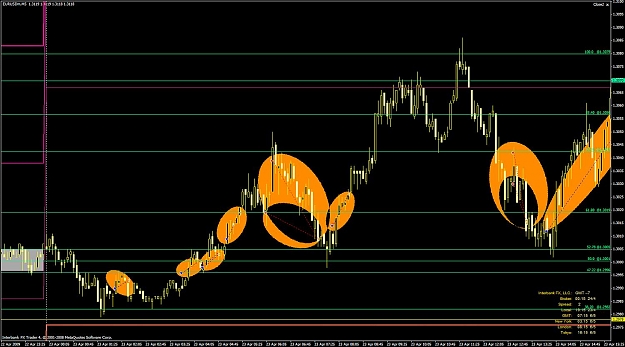
Chart- Day's Trading — Hello. This is a chart showing the trades from EU I took today (DEMO). Ten trades, no losers- 176 pips. I used support and resistance from ICCE and pivots, but mostly ICCE. Otherwise, price action. I'm still trying to ...
ICCE. Bemac's Fib. Reverse Engineered
- kenmania replied Apr 21, 2009
Taking a stab, here. Trading Monopoly money on it.
ICCE. Bemac's Fib. Reverse Engineered
- kenmania replied Apr 18, 2009
Chart- Scalp: 1 min E/U — Here's one for the scalpers.
ICCE. Bemac's Fib. Reverse Engineered
- kenmania replied Apr 14, 2009
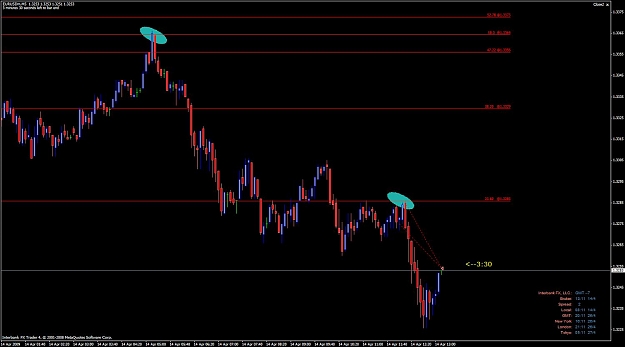
RE: Chart- Eurusd — Chickened out.
ICCE. Bemac's Fib. Reverse Engineered
- kenmania replied Apr 14, 2009
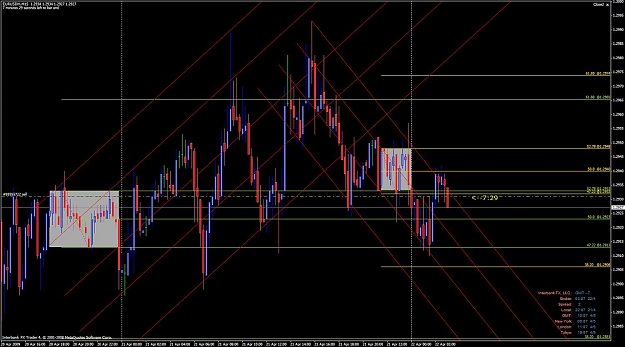
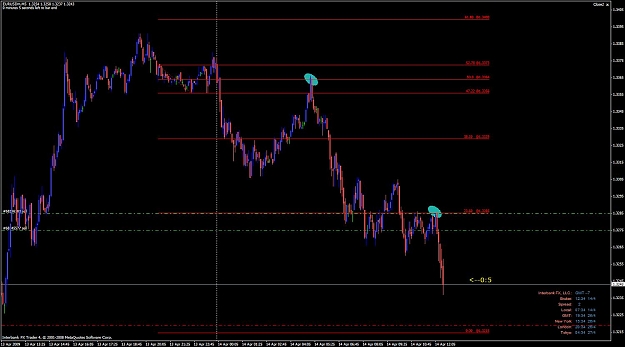
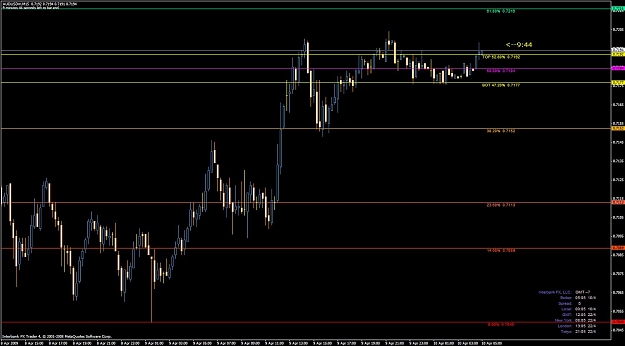
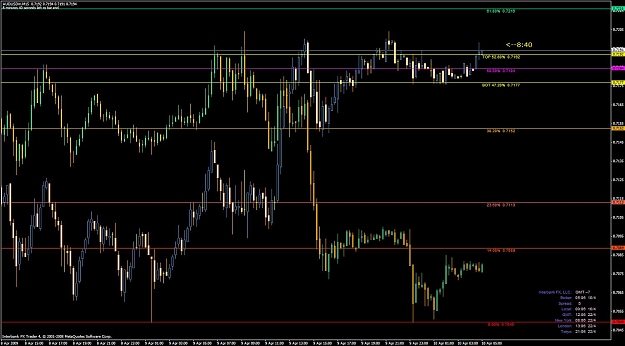
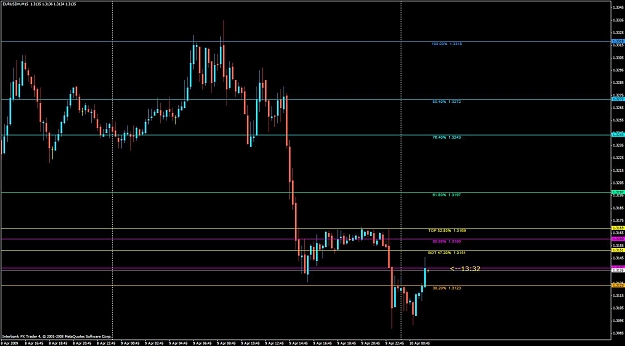
Chart- EURUSD — Plotting the channel on E/U that Bemac spoke of generally happening in the hours before Asia opens, assuming that the tweezer tops @50% (1.3364) really are the halfway mark of the move, I faded the line @ the 23%, and am ...
ICCE. Bemac's Fib. Reverse Engineered
- kenmania replied Apr 13, 2009
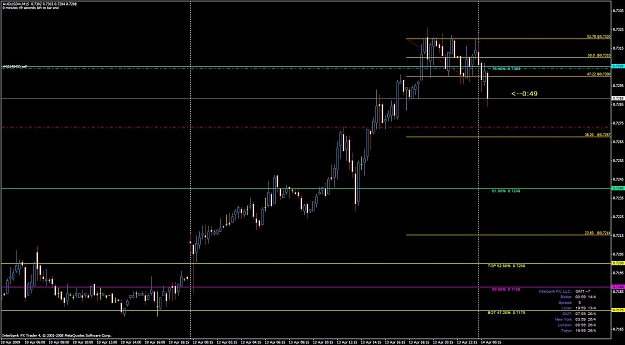
Chart- AUDUSD — Shorted AUDUSD. Actually the upper fib channel was drawn after I took the short- I was entering off the previous channel which looked like support for it had been broken. We'll see if it gets down to 38% (.7267).
ICCE. Bemac's Fib. Reverse Engineered
- kenmania replied Apr 12, 2009
Same chart. 5 minute but with GBP candles shown (red & blue) and scrolled back to identify the ICCE channel I used (brown rectangles). This is an example of one pair's past indicating another pair's future. Neat-O.
ICCE. Bemac's Fib. Reverse Engineered
- kenmania replied Apr 12, 2009
Chart-eurusd over gbpusd — You're right kihl, the whole previous page should be on the other thread. Sorry for the digression. Okay, down to business. One chart. This is 5 min. eurusd, however it is overlaid on a gbpusd chart (gbp candles are ...
ICCE. Bemac's Fib. Reverse Engineered
- kenmania replied Apr 12, 2009
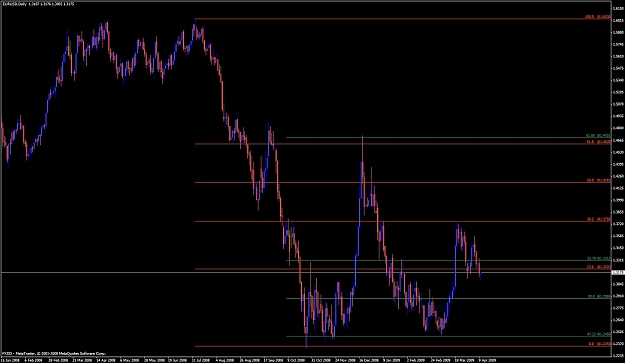
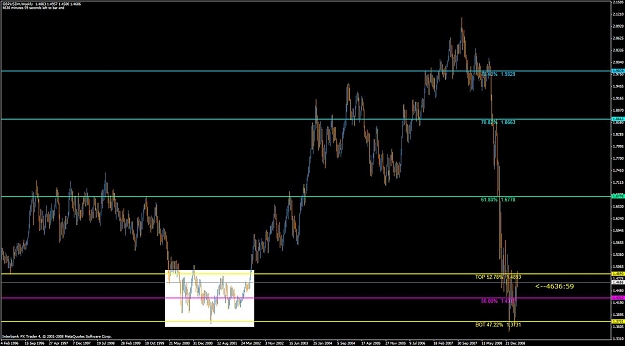
EURUSD Daily w/overlay — 1){Standard Fib} High ~= 1.6036 to Low 1.2350 [RED FIB] 2) (ICCE) 47-52 Channel ~= 1.2458 to 1.3313. [GREEN FIB]
ICCE. Bemac's Fib. Reverse Engineered
- kenmania replied Apr 10, 2009
Chart- kihl's fib tool — Thank you! This will be very useful for observing the fib levels on different timeframes on the same chart. Just change the colors.
Fib. Reverse Engineered.
- kenmania replied Apr 10, 2009
Charts- Audusd-eurusd — Fooling around. Plotted the most recent channel on AUDUSD (first chart). Then overlayed a chart of EURUSD (orange and green candles). Hmmm....
ICCE. Bemac's Fib. Reverse Engineered
- kenmania replied Apr 9, 2009
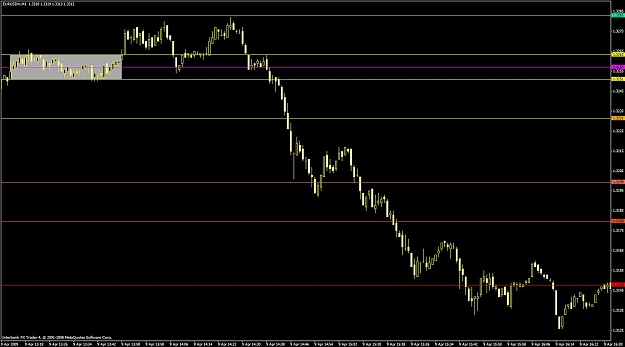
Chart- Reply to smjones — My suspicion is that it's going to run back to the channel that Bemac posted earlier.
ICCE. Bemac's Fib. Reverse Engineered
- kenmania replied Apr 8, 2009
Open it from your Navigator in MT4. Right click the indicator, select "Modify". Regarding the gbpusd daily chart you posted. I'm gonna take a stab and say "down". If you go to the Weekly chart it followed the same channel for over a year in ...
Fib. Reverse Engineered.
- kenmania replied Apr 8, 2009
BTW, I think that gbpusd chart is a good example of what Bemac is talking about with the price returning to its channel.
Fib. Reverse Engineered.
- kenmania replied Apr 8, 2009
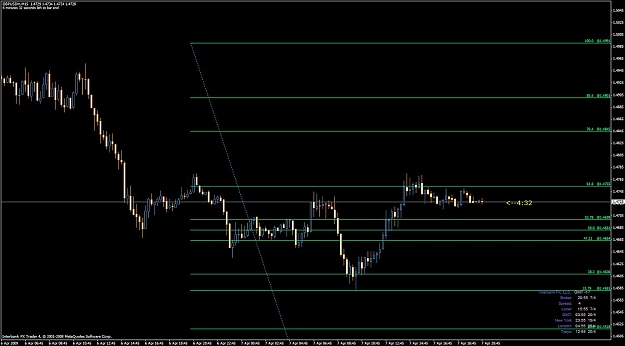
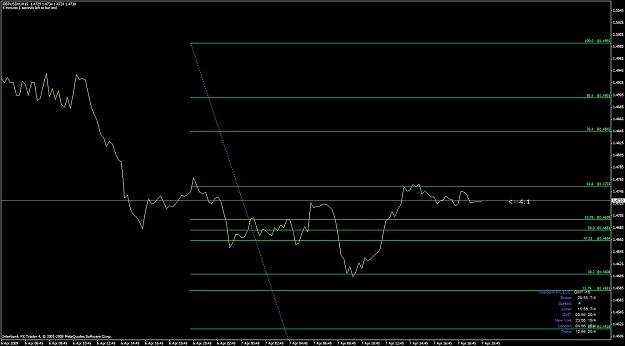
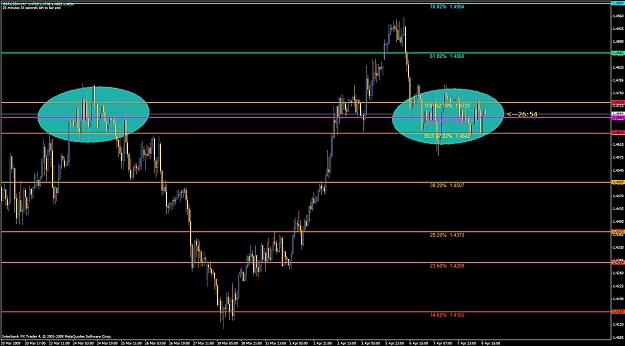
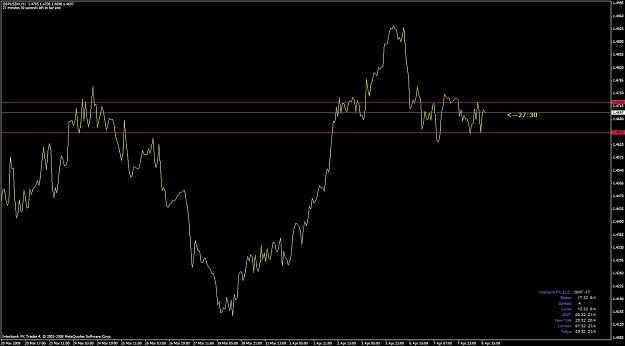
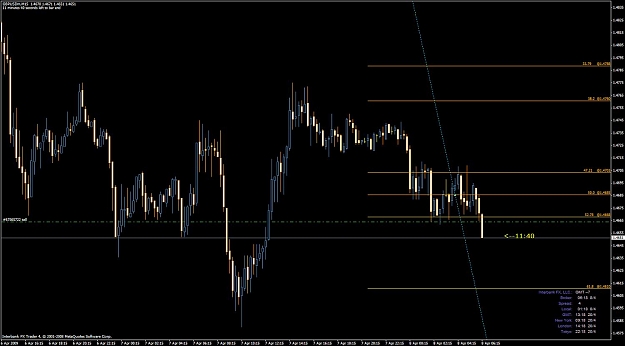
That's the way I see it. This is currently the way I'm using Scott's indicator. I first pull up a line chart, then identify the channel with horizontal lines (first chart). Then I open the indicator and put the top and bottom values from my ...
Fib. Reverse Engineered.
- kenmania replied Apr 8, 2009
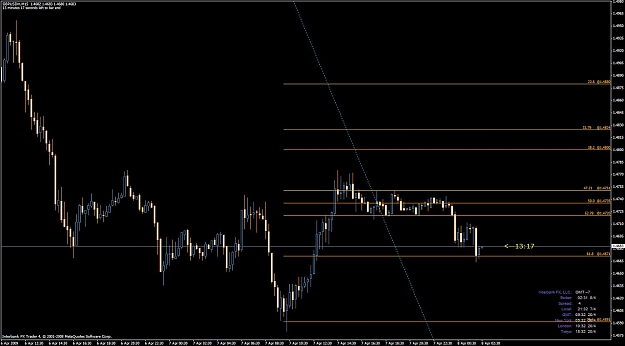
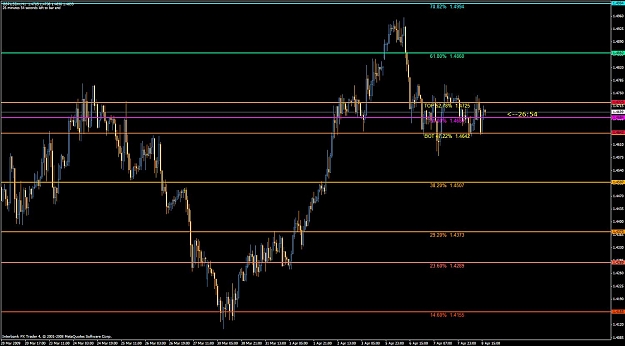
Trying again. This time shorting sterling. Target the 61.8% line @ 1.4610.
Fib. Reverse Engineered.
- kenmania replied Apr 8, 2009
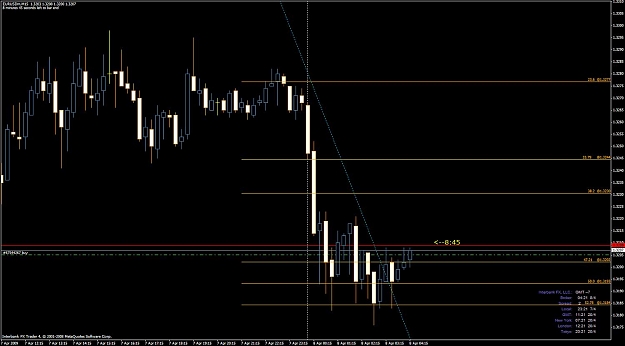
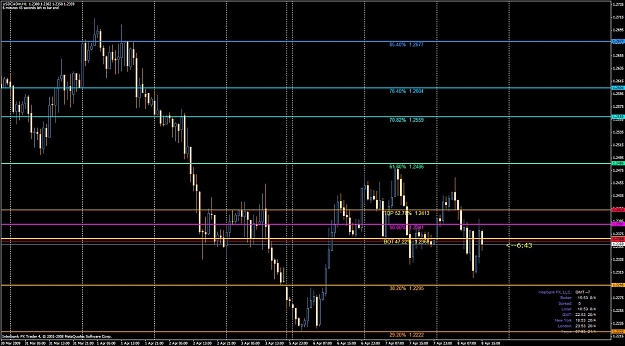
I'm not using the indicator yet. I need to study it more. But I manually fibbed out a channel on the eurusd and I have a buy order in @ 1.3205- targeting 1.3230 (or the 38.2 Fib) for my TP. It should be known I plotted the channel with a line chart.
Fib. Reverse Engineered.