- Search Metals Mine
- 19 Results
-
 kbrown replied Feb 12, 2010
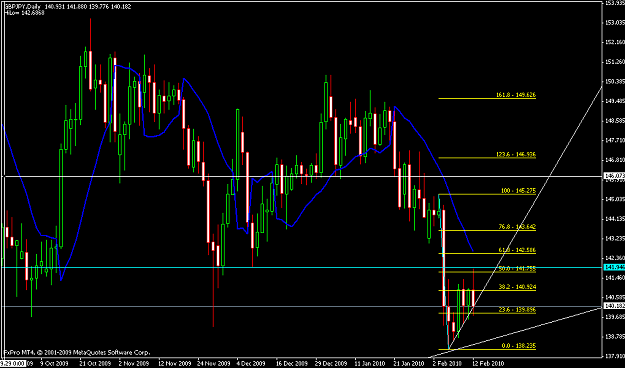
Ewokuk there were valid technicals involved. Price hit a level of resistance 141.88 which was a past level of support seen 2009/12/09 on the daily TF. It also kissed the 50% fib from 145.27 high to 138.23 low, forming text-book twiser tops on the ...
Auslanco - GBP/JPY and GBP/USD (newstrade)
- kbrown replied Sep 1, 2009
I'm keeping it simple..targetting ~148.3 which is a solid level of support on the daily, and is also the 161.8 fib extension on the 30m.
Auslanco - GBP/JPY and GBP/USD (newstrade)
- kbrown replied Apr 6, 2009
Keeping eye on the 153 region to short. A breach below 149.2 will send this beast down to at least 145.6, then 140, targeting 130s this month.
Auslanco - GBP/JPY and GBP/USD (newstrade)
- kbrown replied Mar 30, 2009
buy limit @ 135.85 — Price is almost at the lower TL of the channel. buy limit @ 135.85, SL 70 pips for a revisit to the DPP @ ~ 140.6
Auslanco - GBP/JPY and GBP/USD (newstrade)
- kbrown replied Nov 26, 2008
No break of lower TL — Good morning everyone, No break of lower TL yet, and if we bounce, we could see 148.6x again today, and a possible push to 150. Please note, 146.xx is a good support region.
Auslanco - GBP/JPY and GBP/USD (newstrade)
- kbrown replied Nov 26, 2008
be careful — Rallies have been repeatedly rejected by the 50ema on the 5 mins all of Tokyo. Careful. Edit: see second chart posted 2 mins later....and it's over as quickly as one could create/place/and close an order
Auslanco - GBP/JPY and GBP/USD (newstrade)
- kbrown replied Nov 26, 2008
I prefer to to draw TLs to touch 3 or more points (the more the better - meaning more S/R). In my gbp/jpy chart I would buy above dotted green TL, and sell below dotted red TL.
Auslanco - GBP/JPY and GBP/USD (newstrade)
- kbrown replied Nov 25, 2008
deja vu? — Is this a picture perfect mirror image of the senario that played out on nov 19th repeating itself?
Auslanco - GBP/JPY and GBP/USD (newstrade)
- kbrown replied Nov 24, 2008
Hmmm
Auslanco - GBP/JPY and GBP/USD (newstrade) since the daily bar started above the 5sma (High) I wouldn't be shouting sell sell sell as yet; sure 10C, 14 C, and 1C are showing bearish, however, If and only if we started the daily candle within the 5sma channel would I look ...
- kbrown replied Nov 24, 2008
I wont go long until approx 144.66. .....confluence of the 50 fib, 30min 50ema, and TL
Auslanco - GBP/JPY and GBP/USD (newstrade)
- kbrown replied Nov 24, 2008
diving spring board — My chart is looking like a diver's springboard ready to recoil. I do not see this going below 144.66/143.9
Auslanco - GBP/JPY and GBP/USD (newstrade)
- kbrown replied Nov 24, 2008
It's possible, provided price stays within the red TLs on my chart.
Auslanco - GBP/JPY and GBP/USD (newstrade)
- kbrown replied Nov 23, 2008
Late friday trading saw 15m QQE60 crossing up above the 50 line and Lilmoe's radar detector (CCI30) puncturing the 100 line. We got confirmation coming from that TL break on the 15m/30m/1hr at daily R1 with prices trading above DP, above 1hr/4hr ...
Auslanco - GBP/JPY and GBP/USD (newstrade)
- kbrown replied Nov 23, 2008
We can't ignore the regular divergence spotted on higher TFs — Regular Div on the H4. The price made lower lows, while RSI made higher lows; and I see the same setup on the Daily which suggests a short term rally from here. Do we gap up or ...
Auslanco - GBP/JPY and GBP/USD (newstrade)
- kbrown replied Sep 29, 2008
We are in a strong down trend, we have a evening star followed by treadline break on the 5 min. Also, 30m Stochs are about to cross down and if you count waves we are going to 'C' shortly.
Auslanco - GBP/JPY and GBP/USD (newstrade)
- kbrown replied Sep 29, 2008
yea I'll be long when pigs fly.
Auslanco - GBP/JPY and GBP/USD (newstrade) But I'll remain bearish until my charts say otherwise. Right now we are still below 1hr/4hr gann, and QQE is still crossed down on the higher timeframes.

- kbrown replied Sep 29, 2008
I wasn't available to take a printscreen of the daily chart at the beginning of candle but we started today with very bearish momentums, and the daily stochastics crossed down. Also, H4 is also quite bearish which could hold the price down, IMO.
Auslanco - GBP/JPY and GBP/USD (newstrade)
- Posts by Member Search: 'kbrown'