- Search Metals Mine
- 102 Results
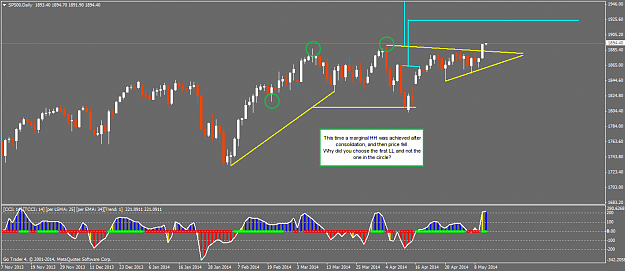
- jsr replied Aug 29, 2014
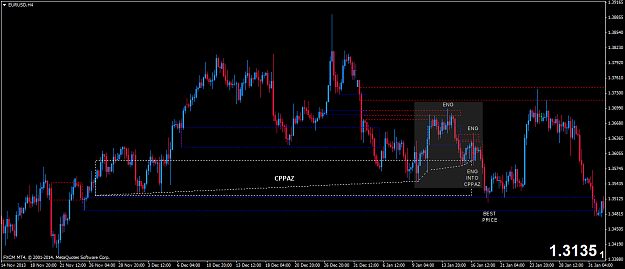
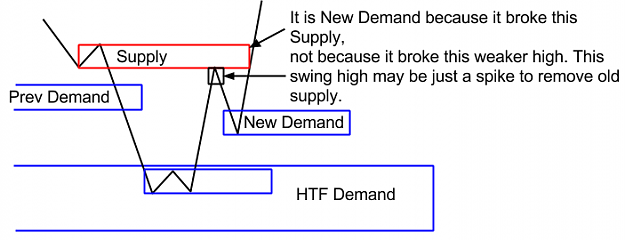
gristar, I gave it a second thought trying to figure it out according to my current understanding of what is taught at RTM. What do you think about this?: Before the engulf you showed us, there was another engulf north. When price retraced and broke ...
ReadtheMarket - Supply and Demand with Price Action
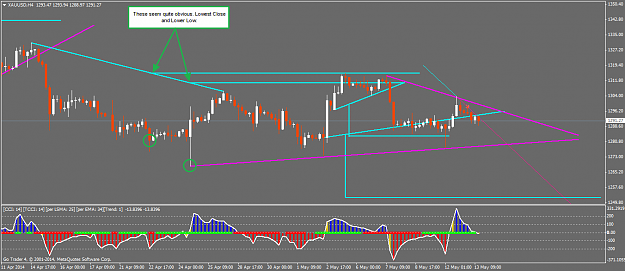
- jsr replied Aug 28, 2014
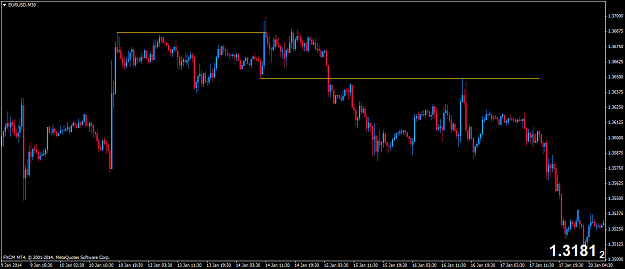
gristar Take this with a grain of salt. Read this post and the next one: url then see if this picture makes sense to you:
ReadtheMarket - Supply and Demand with Price Action
- jsr replied Aug 21, 2014
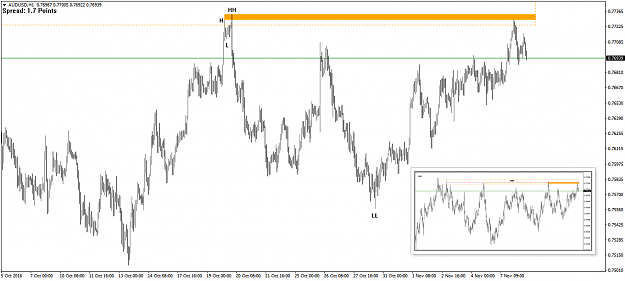
Trader555 This is a quote from post 1. When is a supply or demand level confirmed as a level? We need that the opposing supply/demand area is taken out (absorbed) before we consider an area to be valid AND/OR price making Higher Highs or Lower Lows ...
Supply and demand in a nutshell by Alfonso Moreno
- jsr replied Aug 8, 2014
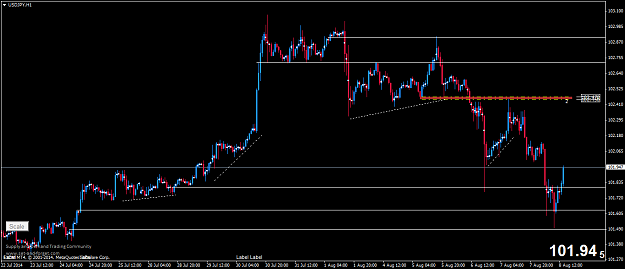
I'm in learning mode, so I'm not experienced, but I don't see this case in USDJPY as a failed setup. I was expecting the drop at that precise level. In fact, you have written about these little fakeouts at swap levels, just beyond a flag. url
ReadtheMarket - Supply and Demand with Price Action
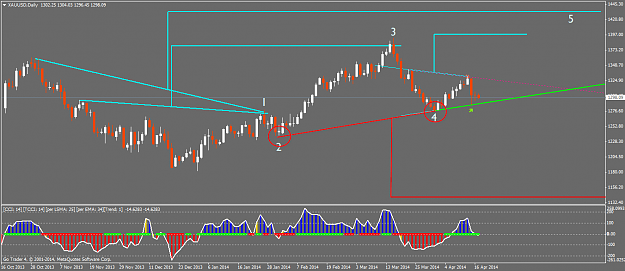
- jsr replied Jan 31, 2014
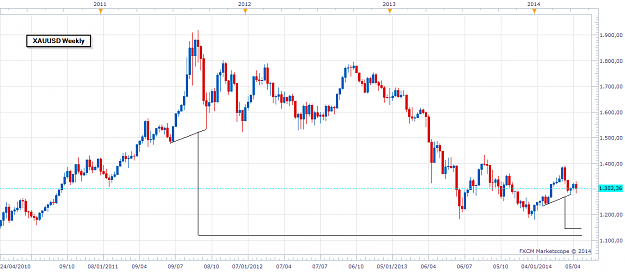
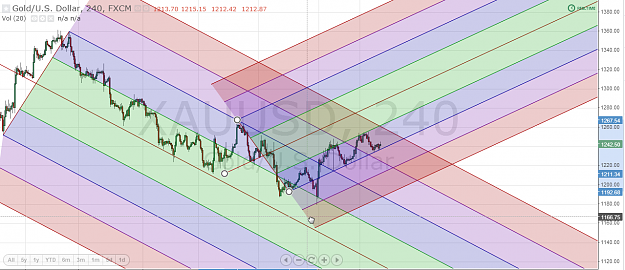
H4 is in downtrend while D1 is still in uptrend. H4 upsloping Andrew's Picthfork had a second and third test to warning line. I try new median lines when a (LL-HH-LL) or (HH-LL-HH) combination is made in the time frame. In this case a H4 upsloping ...
XAU/USD & XAG/USD - Gold & Silver Traders Thread
- jsr replied Jan 16, 2014
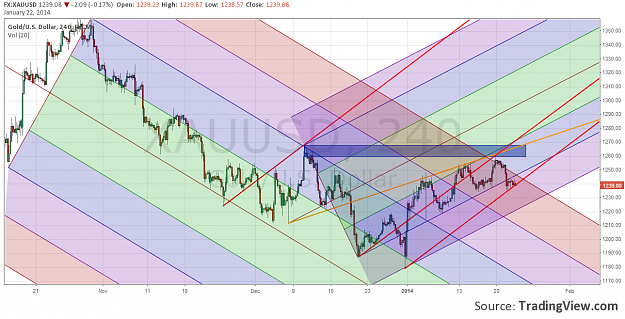
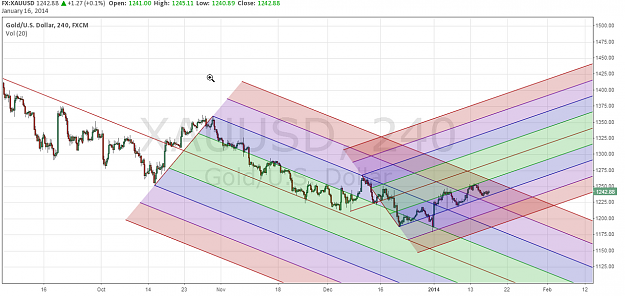
XAUUSD H4. Two slightly different upsloping pitchforks. The "wrong" one is showing better interaction with the path of the price and true support so far, but swing highs seem to have been losing energy.
XAU/USD & XAG/USD - Gold & Silver Traders Thread
- jsr replied Jan 8, 2014
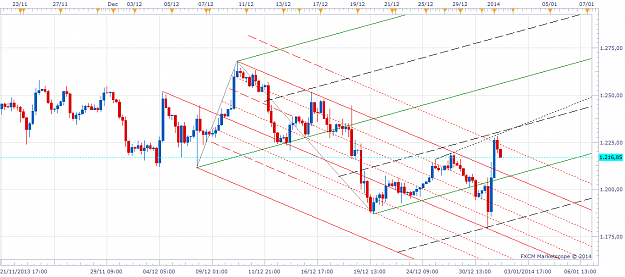
Hi Jason. I've noticed that sometimes MT4 shows a gap that is not present in TSII/Marketscope. Why is that? Gaps play an important role in trading. See this example in XAU/USD.
FXCM Discussion
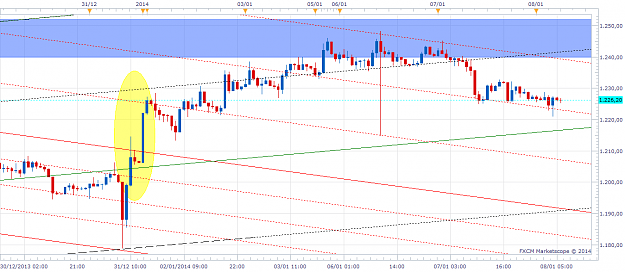
- jsr replied Jan 6, 2014
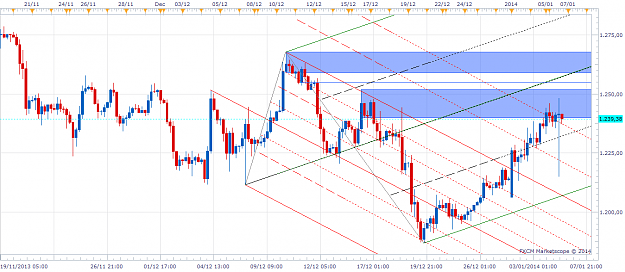
XAU/USD m30 Chart, 30 days data range and H4 chart, 30 days data range. They are different. In m1-m30 charts all data is there. In H1 charts an larger TFS , Dec 29,30 and 31 data is missing.
FXCM Discussion
- jsr replied Jan 6, 2014
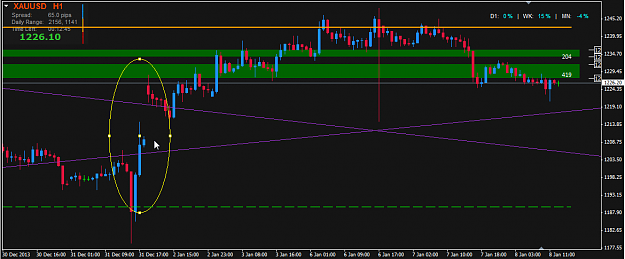
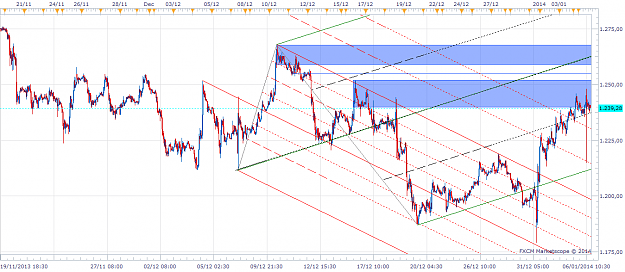
Hi there. What happened to our data? This is Gold. Snapshots from 2014/01/02 and 2014/01/06. 2013/12/30 and 2013/12/31 data are missing. Look how this data loss made useless the sliding parallels drawn by hand. Also, people relying on indicators ...
FXCM Discussion
- jsr replied Jan 2, 2014
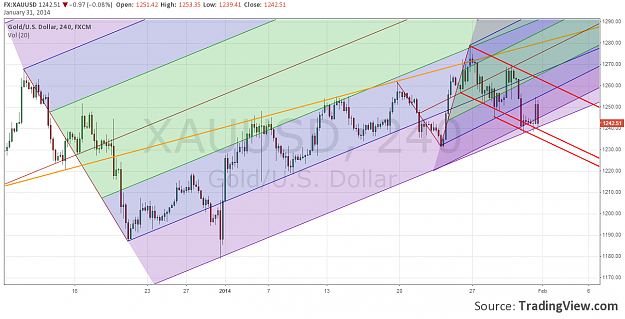
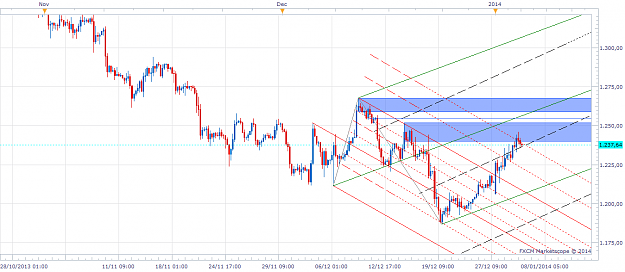
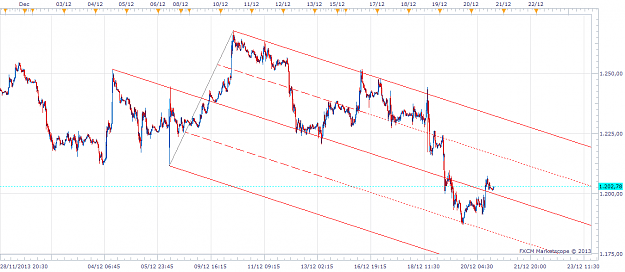
H4. Price interaction with two opposing slope pitchforks.
XAU/USD & XAG/USD - Gold & Silver Traders Thread

- jsr replied Dec 30, 2013
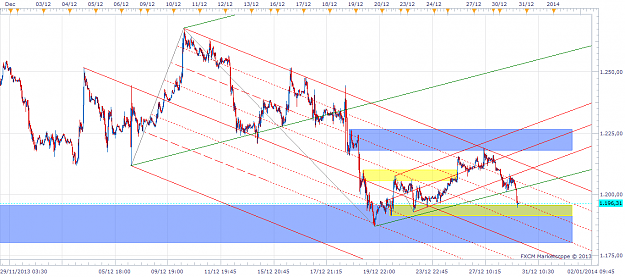
Dec 20 vs Dec 30, xau/usd m15
XAU/USD & XAG/USD - Gold & Silver Traders Thread
- jsr replied Dec 20, 2013
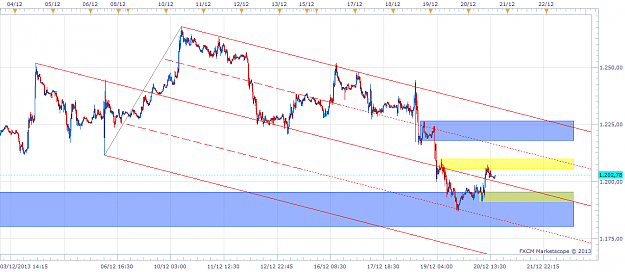
m15 Andrew's Pitchfork Second image with nearest Supply and Demand Zones / Blue=H4, Yellow=H1
XAU/USD & XAG/USD - Gold & Silver Traders Thread

- jsr replied Oct 2, 2013
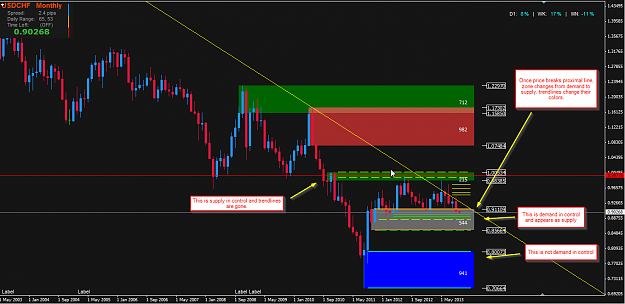
Hi there. I've been experiencing a bug that affects the calculation of the curve. Once price penetrates the proximal line of the SD zone in control the zone is changed from demand to supply or viceversa. So, I think that the algorithm must use ...
Rectangle extender indicator for Metatrader 4
- jsr replied Sep 2, 2013
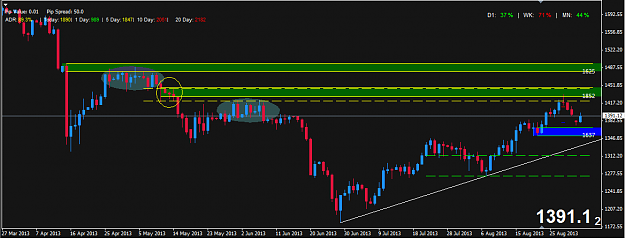
In my charts, W1 and D1 look diferent. This is Daily: 2 levels highlighted with elipses with too much trading, so I used as D1 supply level the zone just between those 2 levels. Only 4 candles. Three last candles were within the range of the first, ...
Supply and demand in a nutshell by Alfonso Moreno