- Search Metals Mine
- 26 Results
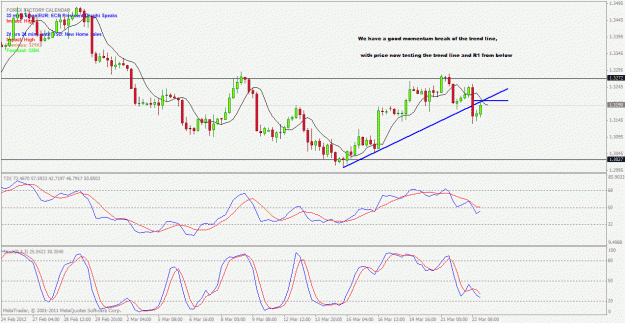
- joffie replied Apr 2, 2012
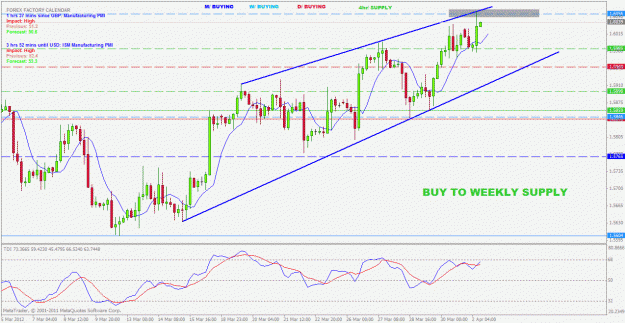
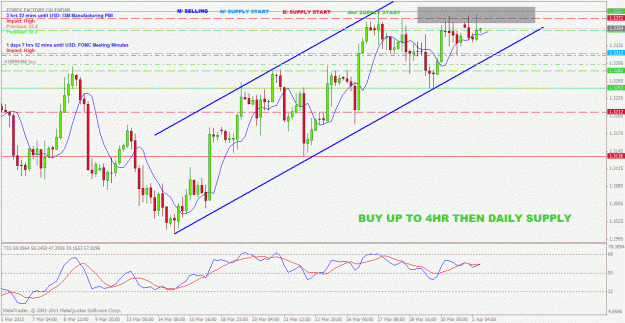
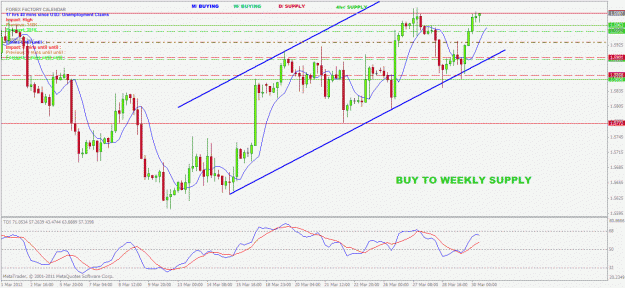
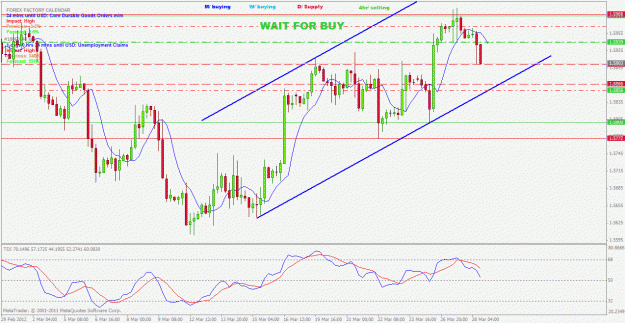
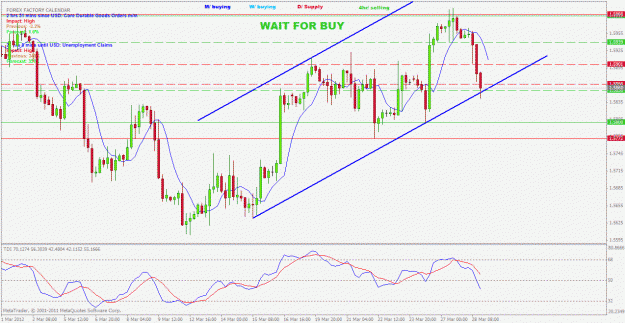
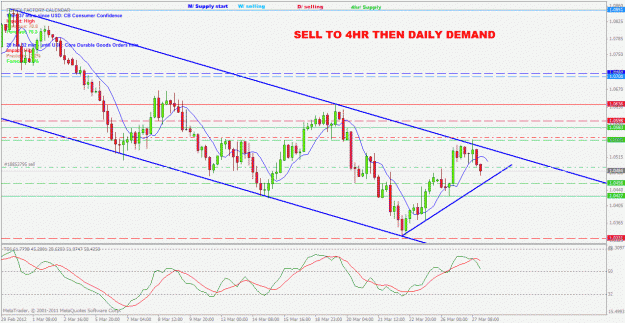
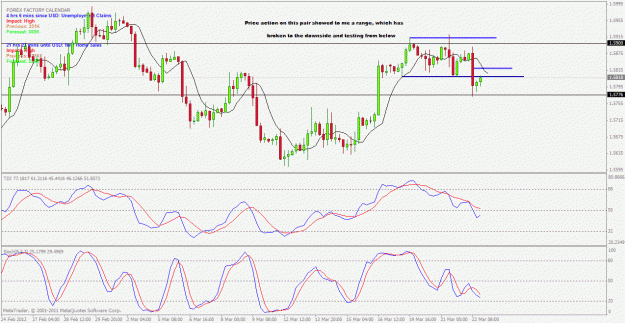
Just took profits on gbpusd buy from last week, took profits at a confluence of levels- being the daily and weekly supply start levels of their zones, and top of a up forming wedge. Am still in the buy as well on eurusd, but this pair is showing ...
Trading Made Simple
- joffie replied Mar 30, 2012
Here was a perfect example of another great trade, even though I did not take as of friday, it is still good to see the entry was a good one. Yet another winning trade, and see how well I was able to know in advance my target level using supply and ...
Trading Made Simple
- joffie replied Mar 30, 2012
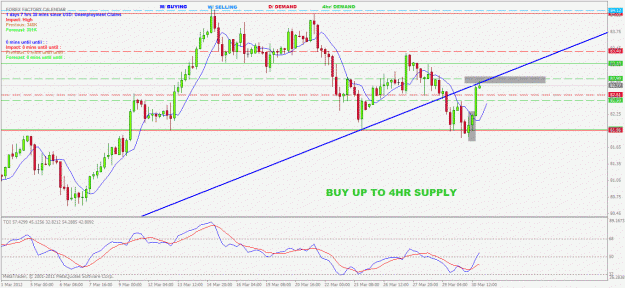
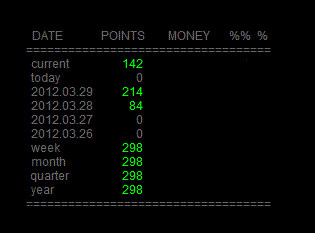
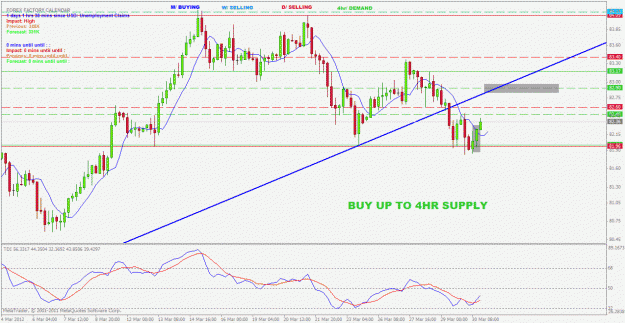
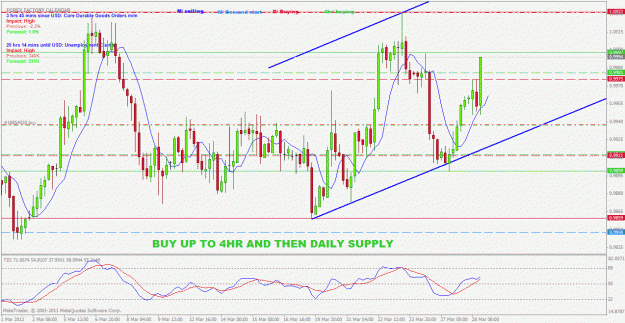
So far this week, being my first week adding the supply and demand zones with this method. I have made 298pips with open 142pips. I also saw this entry for a buy on the usdjpy, coming of a daily and 4hr demand with cross of tdi and close above the ...
Trading Made Simple
- joffie replied Mar 30, 2012
Took buy on the gbpusd as got the close back above the 5ema and bounce trade on the tdi. Also took a buy on eurusd, sooner than this method, based on my entry method, but the thing to see is yet again this works. joffie
Trading Made Simple
- joffie replied Mar 29, 2012
For new traders to this thread, this is the results you can acheive with this method when used correctly, a update of my audusd sell and buy on the usdcad trades. joffie
Trading Made Simple
- joffie replied Mar 29, 2012
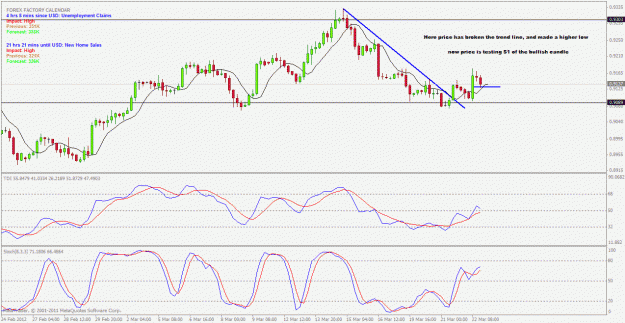
Here is one might just be that loss, not sure yet if price will continue lower to the demand levels I are looking for, the last 2 lower wick candles suggest it may go higher, but am going with my original plan to sell the gbpusd. joffie
Trading Made Simple
- joffie replied Mar 29, 2012
This is one to watch for, the usdjpy is at a major level, either see a bounce off here or looking for a break down. joffie
Trading Made Simple
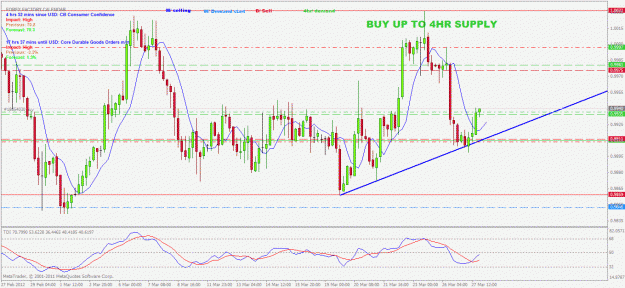
- joffie replied Mar 29, 2012
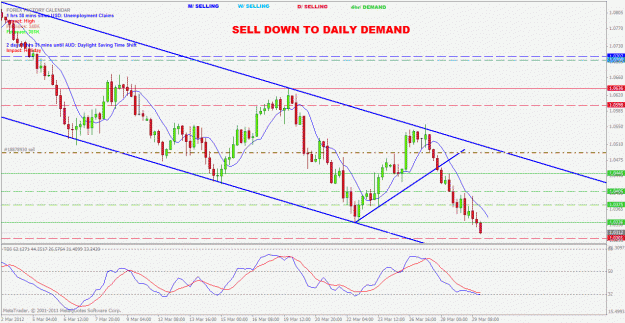
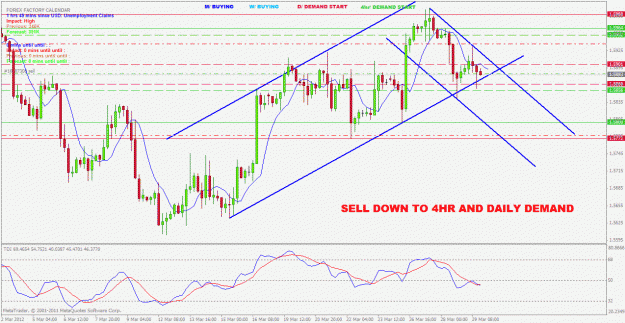
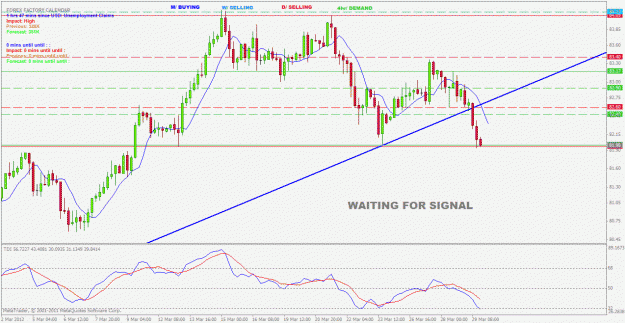
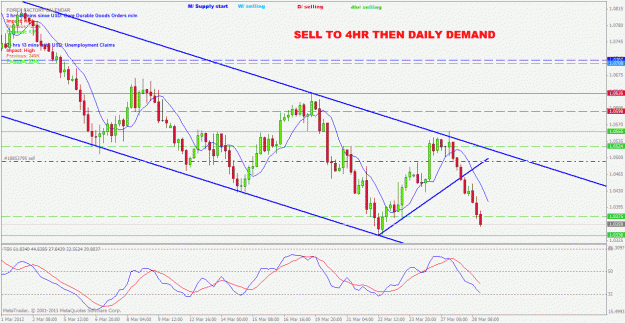
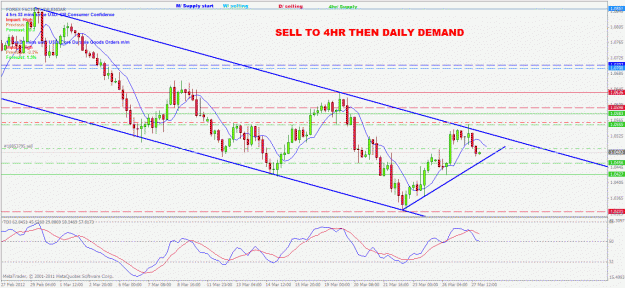
I have a set-up I may take at close of this 4hr candle, being in 1.5hrs time, I sold yesterday down to the trend line and start of 4hr/ daily demand, where if you look at the charts you will see price gave a bounce of this trend line area. I still ...
Trading Made Simple
- joffie replied Mar 28, 2012
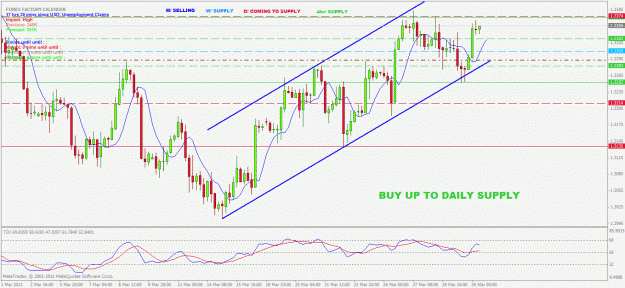
Trades I have taken this week update. Took sell on the gbpusd today and took profits at my level, still in the audusd sell, and buy on the usdcad. joffie
Trading Made Simple
- joffie replied Mar 28, 2012
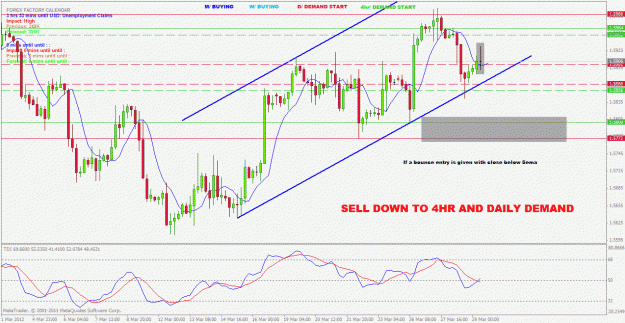
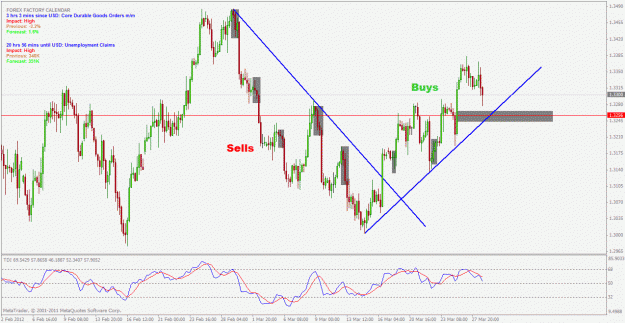
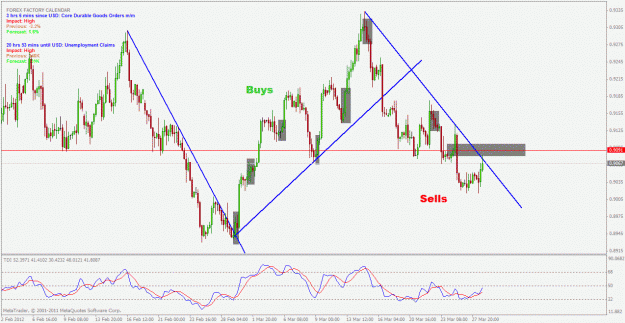
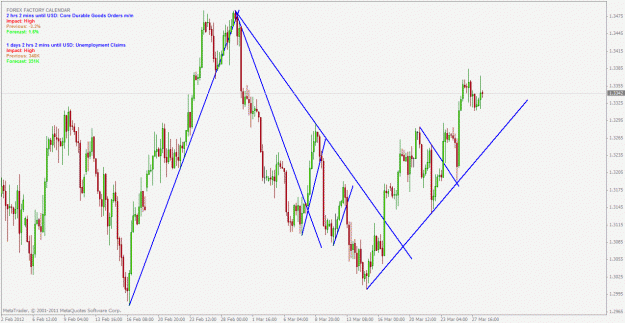
Hi, I have posted a chart of the 2 pairs in question, placing my trend lines on the charts, and showing my entry candles within the shaded area's. The only difference's are that I follow price at key area's of supply and demand, and support and ...
Trading Made Simple
- joffie replied Mar 28, 2012
[quote=chewz;5518922]Joffie when drawing trend lines, how do you understand exactly where to draw them? Ive always had issues with them and its probably just me. Have a look at screenshots below and see if you can see anything in them. I would ...
Trading Made Simple
- joffie replied Mar 28, 2012
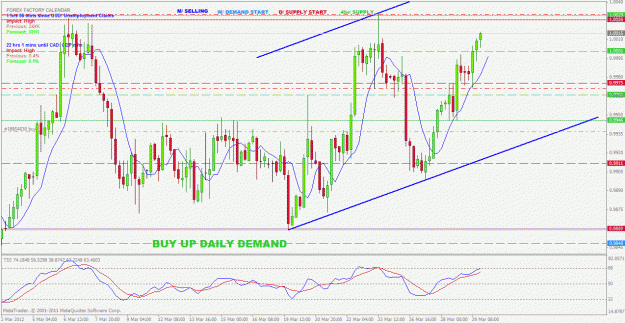
Hi all, attached are 2 trades I took yesterday based on price action first then a entry with the Tdi and 5ema. Audusd and usdcad are the 2 pairs I took trades on. But from reading a post from Chewz, I do beileve this has been taken away from the ...
Trading Made Simple
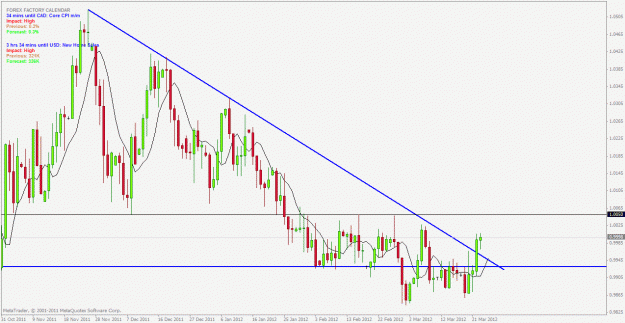
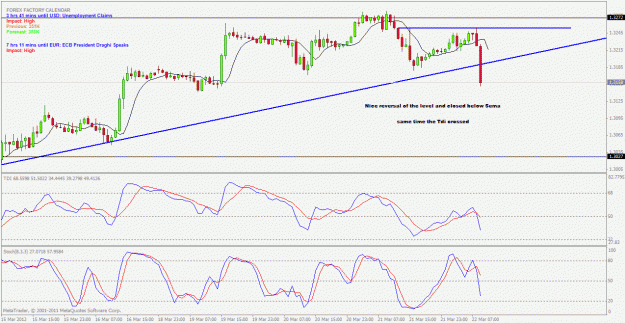
- joffie replied Mar 23, 2012
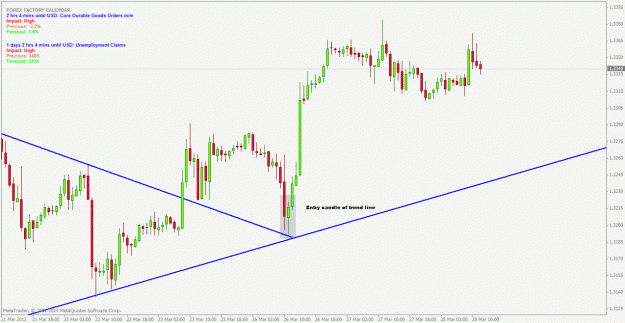
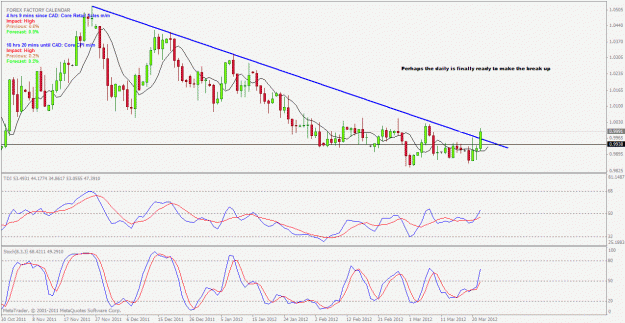
Just a quick note, I know how this method has been layed out to take trades, but you must watch the bigger picture. Take a look at this Daily USDCAD chart, price has been finding support around the weekly level, and now yesterday price broke through ...
Trading Made Simple
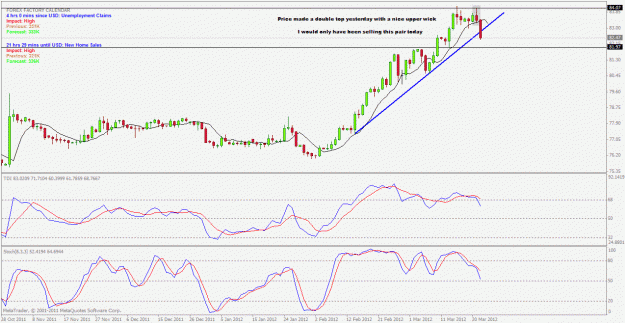
- joffie replied Mar 22, 2012
This is what I saw this morning for the USDJPY pair, a very nice double top of a resistance with a upper wick pin bar closing down, would have expected price to drop here today and if I had seen the set-up sooner I would have sold on the break of ...
Trading Made Simple
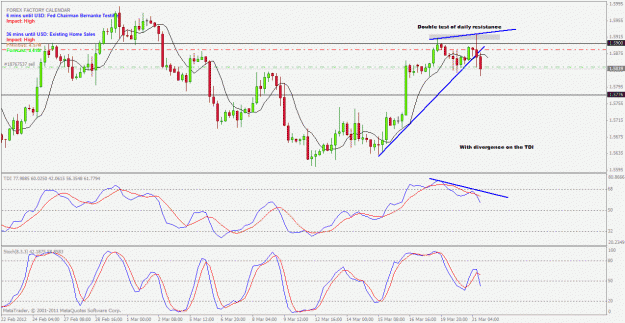
- joffie replied Mar 22, 2012
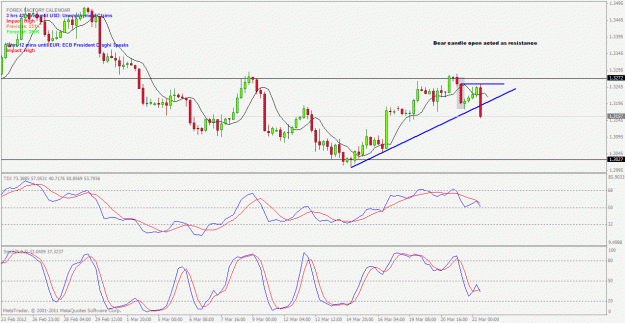
I missed this entry while coming to work, a very good sell if using 1hr for a entry. This is based using candlesticks, as before see the bear candle open R2 acting as resistance, then moving to the 1hr a perfected sell of this level. More and more I ...
Trading Made Simple
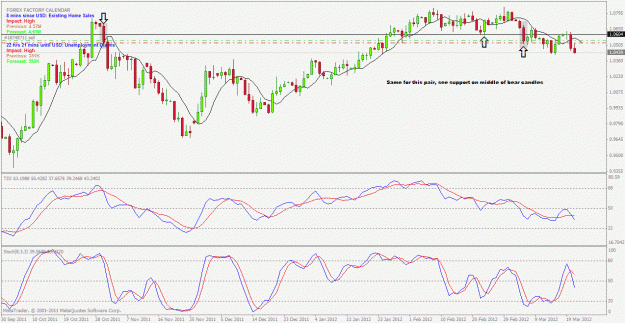
- joffie replied Mar 21, 2012
Here is the audusd where I found my resistance for the sell I took. Once again see how the bearish candles found R1 at the middle as well as a support which had been broken and tested from below. You see as good as this method is, and it is very ...
Trading Made Simple
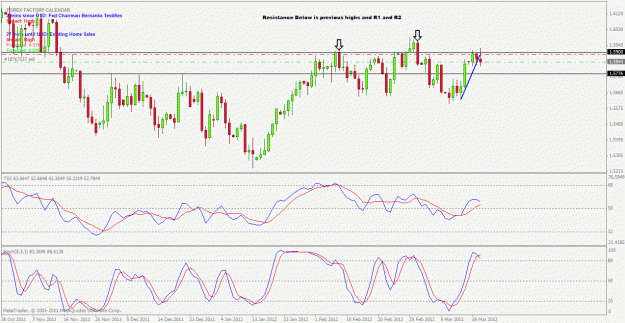
- joffie replied Mar 21, 2012
Here is a chart of the daily gbpusd, do you see here how even though resistance was at previous candles highs, we also have a open and middle R1 and R2 levels acted as resistance on 2 bearish candles. joffie
Trading Made Simple
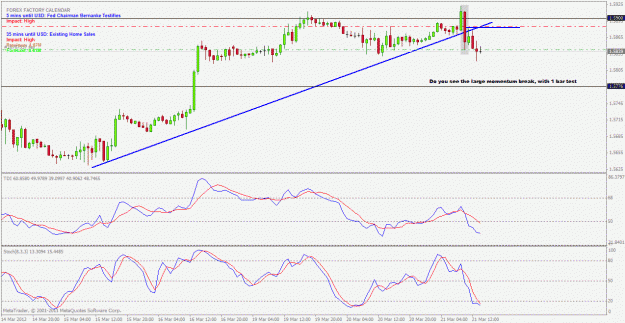
- joffie replied Mar 21, 2012
I did try the APB candles but as I have always traded with candlesticks I prefered using them instead, the entry I took even though it also showed with the simple 4hr method on here, do you see the large momentum bearish 4hr candle, then a small ...
Trading Made Simple
- joffie replied Mar 21, 2012
A update on the audusd sell I took, still in profit with some locked in. I stand by what I said before on this pair and it shows once you can master price action with this method you will make pips. joffie
Trading Made Simple
- joffie replied Mar 20, 2012
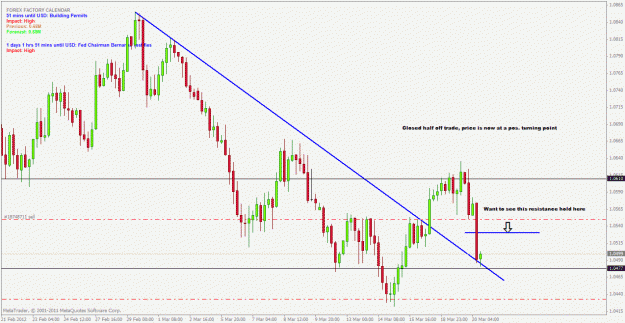
I have attached update of trade, price is at a trendline test after the break to the upside, so have closed half of the trade and now wait for a exit. joffie
Trading Made Simple