- Search Metals Mine
- 31 Results
- jay_ replied Apr 26, 2014
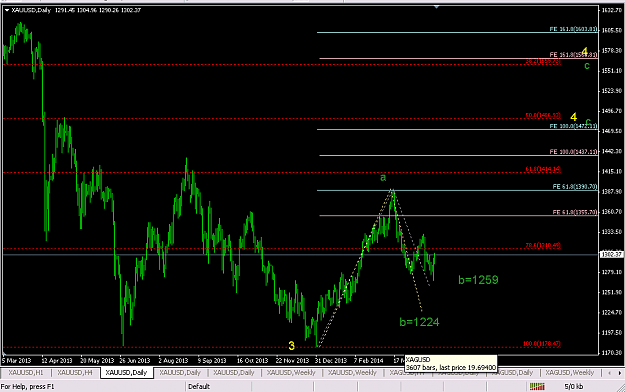
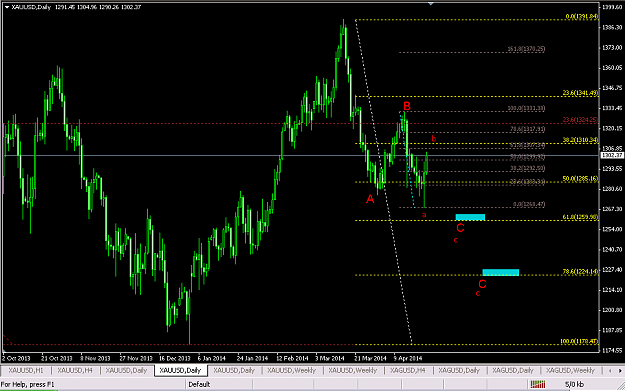
hi GNOMONEEY, see you after a very long time. Here is my view for gold with a medium term horizon. Below snap shows after reaching a level of 1307, 1310 or 1317 level marks, a short term down trend until 1259 or 1224 level marks should be on target. ...
All Majors and Gold
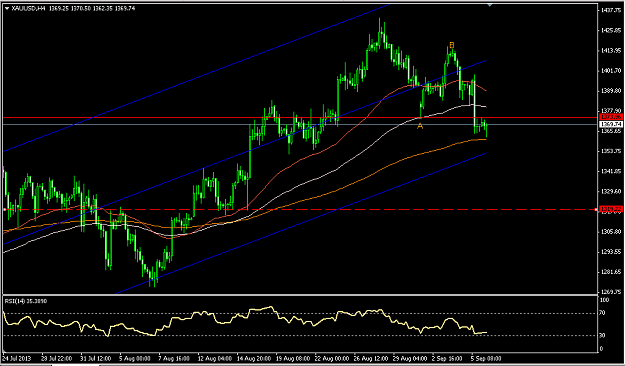
- jay_ replied Dec 12, 2013
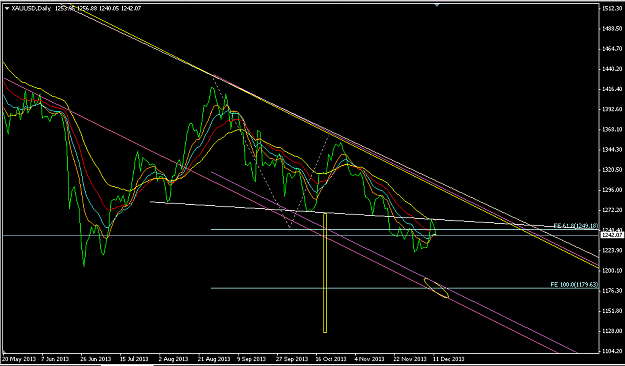
yes, i much prefer EW with Fib and Fib extension. and get focus on HS pattern completed on closing basis. here is my view image i also apply my technical knowledge in Indian equity market and get 110% return in only 8 months. its really amazing ...
All Majors and Gold
- jay_ replied Dec 12, 2013
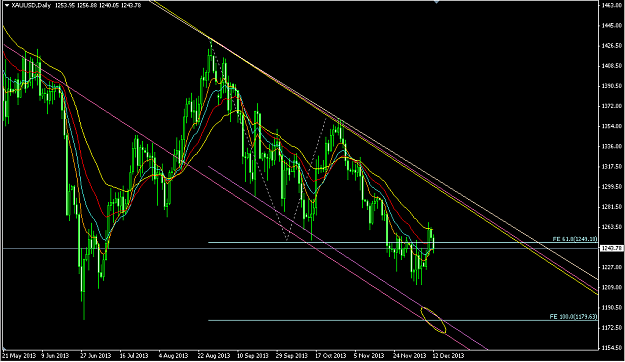
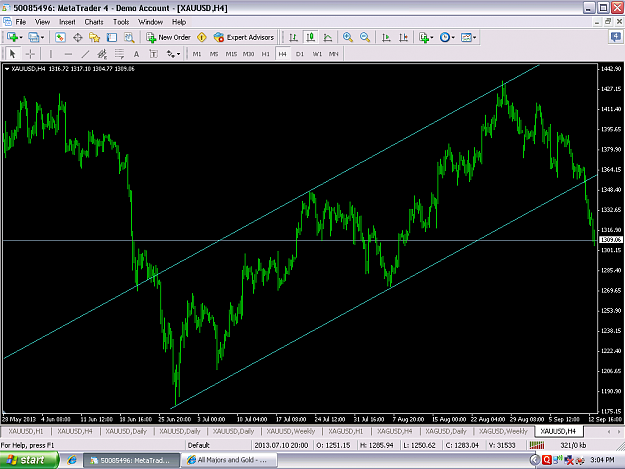
after so many days, come here to share my views. image i have so much fear to loose my money by doing trade in this much volatile forex market. but Gno i am so much thankful to you because i am getting well knowledge by learning your uploaded ...
All Majors and Gold
- jay_ replied Oct 31, 2013
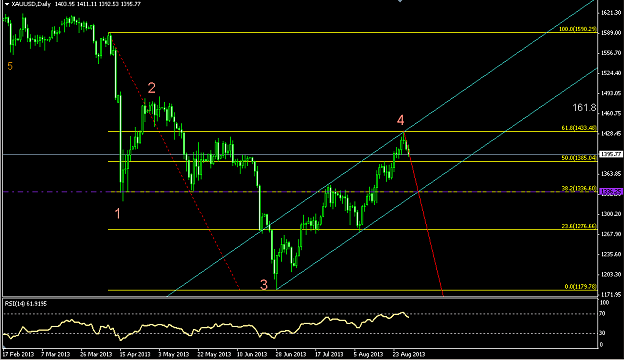
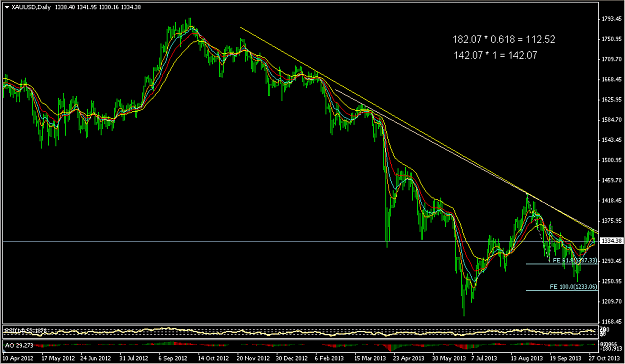
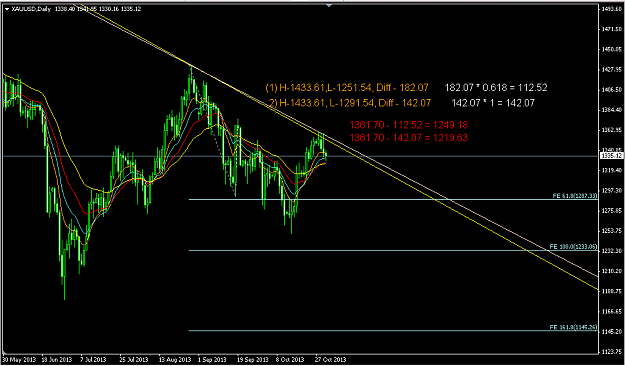
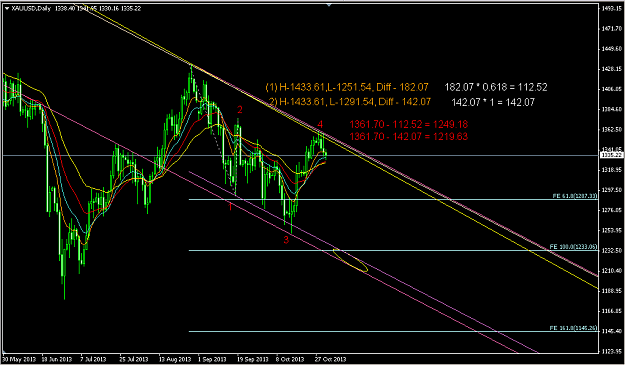
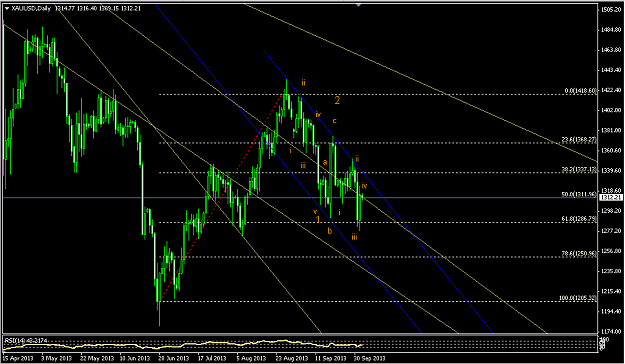
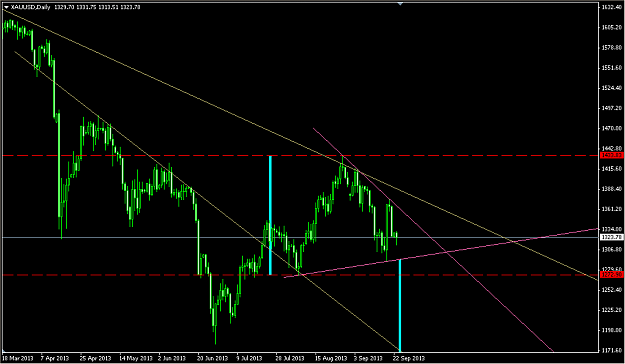
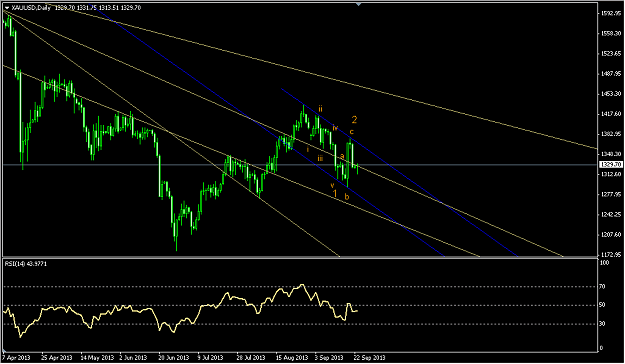
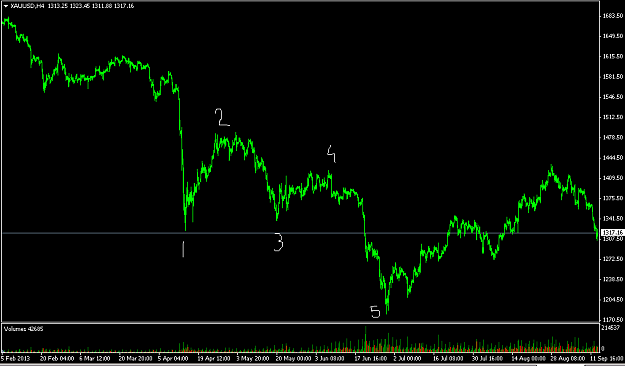
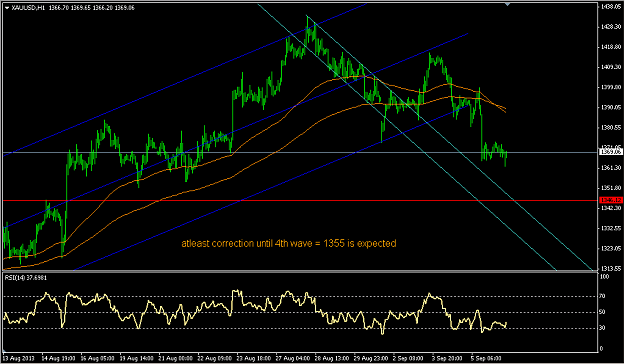
image Above chart shows overall views of market. image Above 2nd chart shows that market test resistance line and further fall for 5th downside wave after finishing A-B-C pattern of 4th wave according to Elliott Wave theory, there are two ways ...
All Majors and Gold
- jay_ replied Oct 3, 2013
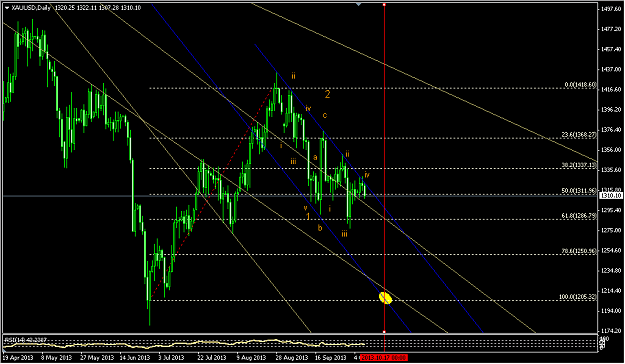
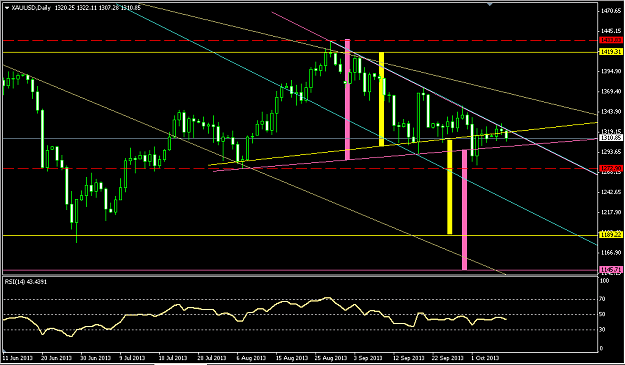
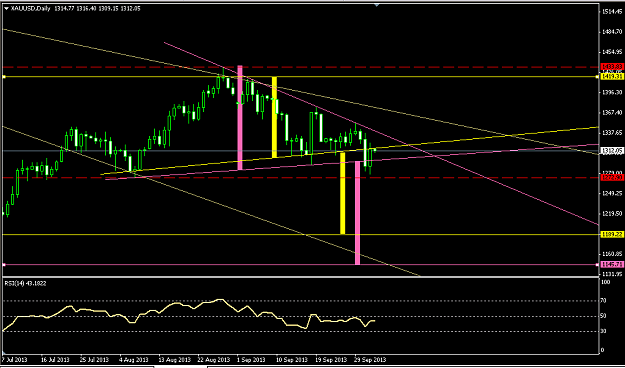
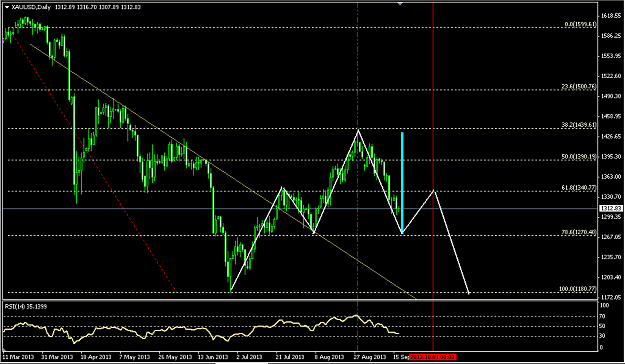
daily chart with EW and Fibo image daily chart you can say descending triangle or head and shoulder pattern. yello colour for closing price base pink colour high & low basis preposted chart with editing image Gno tell me if anything wrong... ...
All Majors and Gold
- jay_ replied Sep 26, 2013
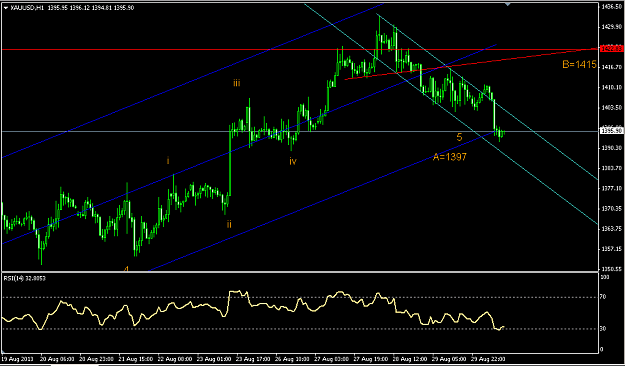
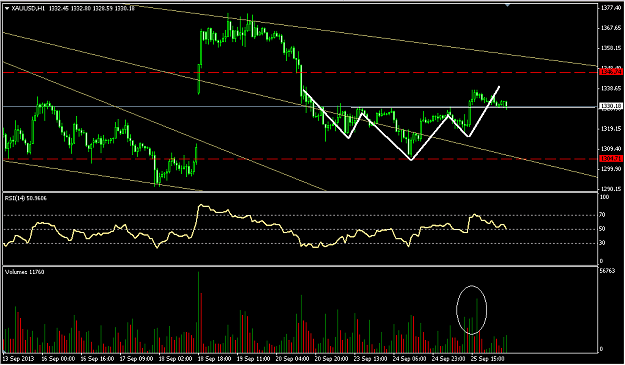
inverse h & s on h1 tf. image still valid for trend line confirmation
All Majors and Gold
- jay_ replied Sep 23, 2013
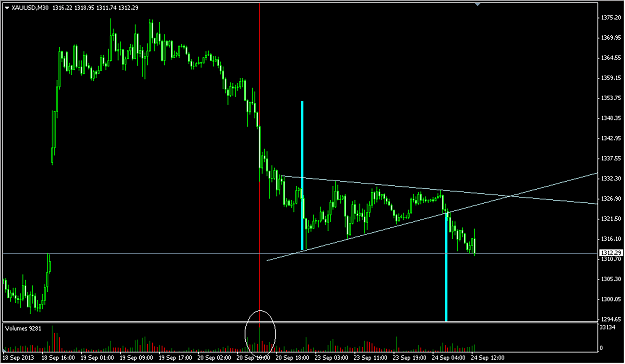
Also there is possibility of descending triangle, and almost all conditions comes true expect volume. Let's see what amount of volume occur, at the time of breakout of the support line. image target of 110x
All Majors and Gold
- jay_ replied Sep 17, 2013
moving towards down, up and full down on daily basis neckline 127x and shoulder 134x, target of 110x
All Majors and Gold
- jay_ replied Sep 14, 2013
move towards neckline for the confirmation of further down trend. also there is trend line resistance.
All Majors and Gold
- jay_ replied Sep 13, 2013
hi scott, below chart suggest 3rd is not lower than 1st low, and in EW 3rd is more bigger(smaller) than 1st always. And it fails for that hence that's not an ABC correction.
All Majors and Gold
- jay_ replied Sep 13, 2013
Hi Gno.... I want to know why this 5 wave EW channel is not complete after 4th wave? I can't understand that.... please brief it....
All Majors and Gold
- jay_ replied Sep 6, 2013
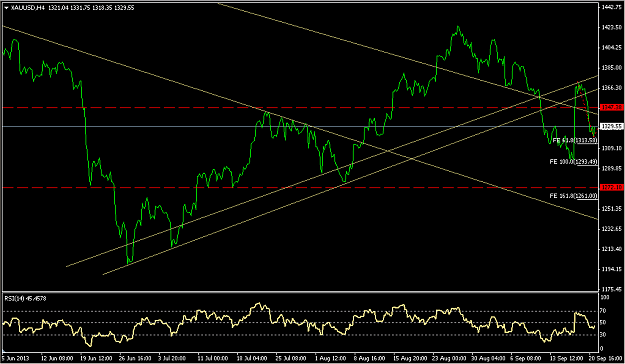
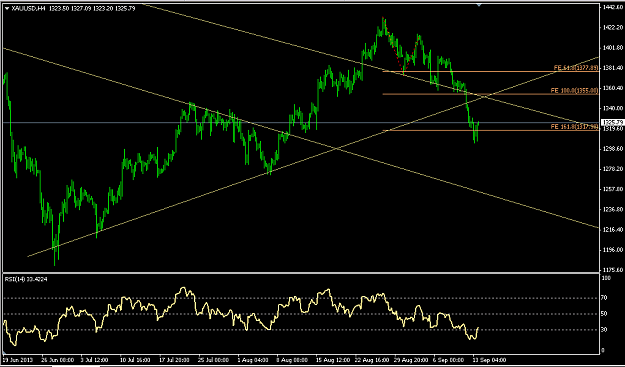
There is also ABC formation on H4 chart. And there is strong bear candle in breakout of A point from B point. And there is hope that later on US data will be positive. So i think there is possibility of correction until 1319. let's see what ...
All Majors and Gold
- jay_ replied Aug 31, 2013
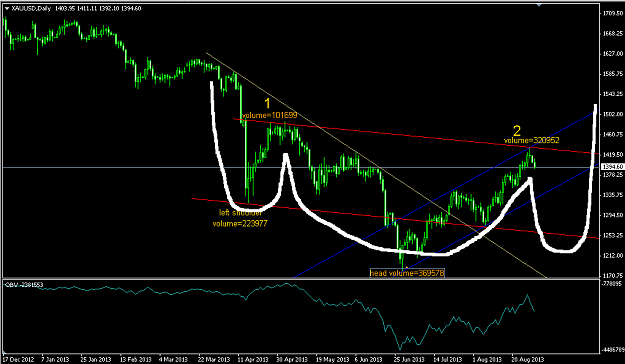
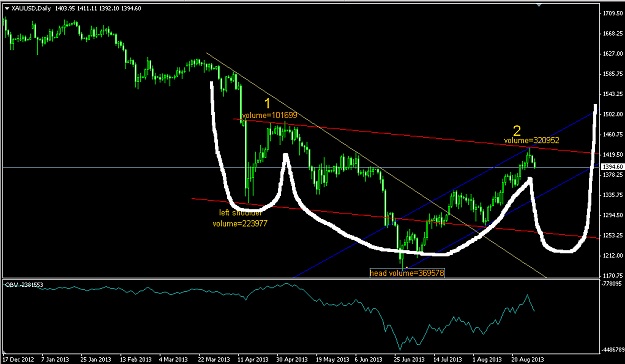
Hi G i m bit confuse with this head and shoulders bottom formation. I can't get idea whether it is right or wrong because volumes as well as time span and patterns to form left & right shoulders are not matching.. Please make some light on this... ...
All Majors and Gold
- jay_ replied Aug 31, 2013
hi to all KADC i read your comments on head and shoulder top formation here is head and shoulders bottom formation on daily chart.... i am little bit confuse with this bottom formation design.. because volume levels are not match, also time span is ...
XAU/USD & XAG/USD - Gold & Silver Traders Thread