- Search Metals Mine
- 22 Results
-
 indalico replied Jun 3, 2020
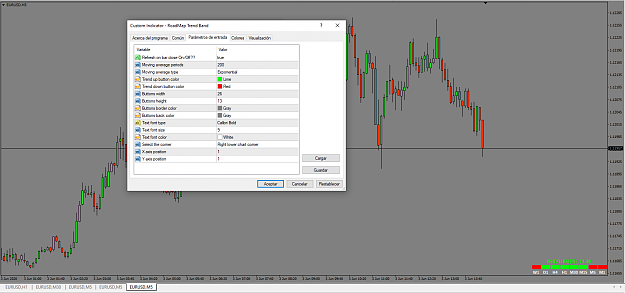
Hello everyone, this is my small contribution in case someone finds it useful. I have merged the trend band with the RSI strenght into a single indicator, simplified the code and added the option to refresh only on bar close to optimize MT4 ...
Roadmap - A Way To Read Markets
- indalico replied Apr 7, 2017
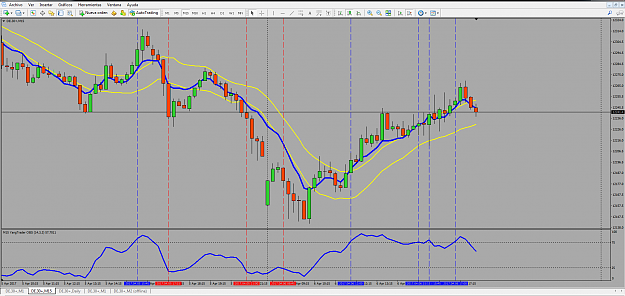
Thank you so much Phylo, Yang trader is an oscilator similar to stochastic but a it faster, the two bands are just like an envelopes SMA and represent the Overbought and the Oversold levels (75/25) and the blue line is the Yang trader oscilator, in ...
I will code your EAs and Indicators for no charge
- indalico replied Apr 6, 2017
Hi all, I need some help friends, I have done an multitimeframe On chart Yang trader oscilator but I think it is not very well programed because it use too much computer resources when you use a diferent timeframe. Could somebody check and do the ...
I will code your EAs and Indicators for no charge

- indalico replied Dec 12, 2016
In the following chart the blue-red moving average is the 100 pips indi cross 9 periods setting, the SSH, the ASH and your IMDX oscilator and we can look that the signals are similar, after the double dot the 100 pips change colour, the ASH change ...
Trading with Super signals channel
- indalico replied Dec 8, 2016
Dear Arabier, I just explained on post 80, Quantum and super signals are same indicator, just SS is back shifted, look the following chart it have Quantum 300 and SS 300 with no back shift, you can look exactly same signals in both indicators, ...
Trading with Super signals channel
- indalico replied Dec 8, 2016
Hi friend, The system not repaint, repaint the SSH the ASH is and smoothed RSI and not repaint, we are testing in 15 minutes for a diferent timeframe you have to test with diferent settings, Anyway thank for your input. Quantum indicator is donchian ...
Trading with Super signals channel
- indalico replied Dec 8, 2016
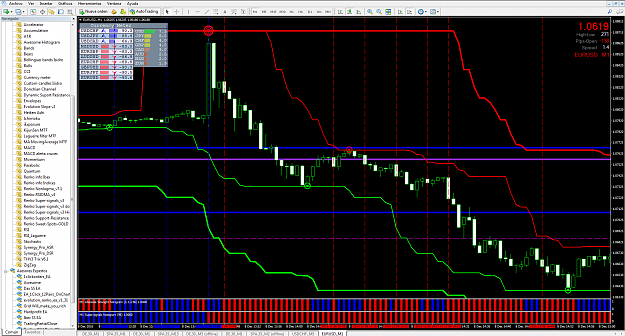
Dear Maxwell, I look you are testing in 1 min chart and with too many indicators, the original settings are for M15 chart and just with the 2 histograms and the double channel. The logical of the SS channels is to find a reversal area and trade ...
Trading with Super signals channel
- indalico replied Dec 7, 2016
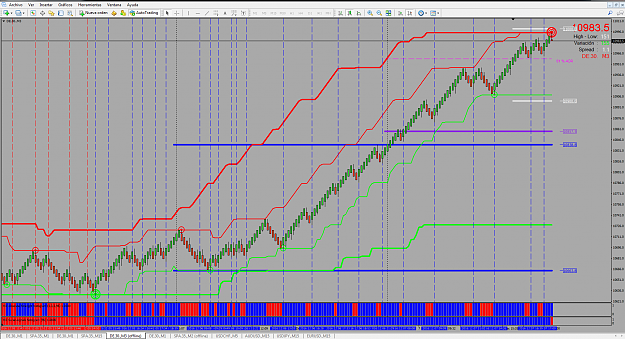
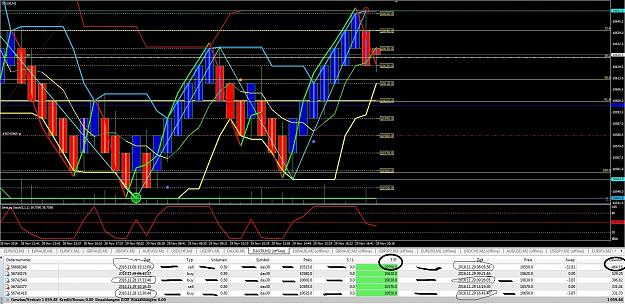
Dear Rammstein, After to look your Dax chart I tested on Dax renko chart and not look bad with the same original settings. image
Trading with Super signals channel
- indalico replied Dec 7, 2016
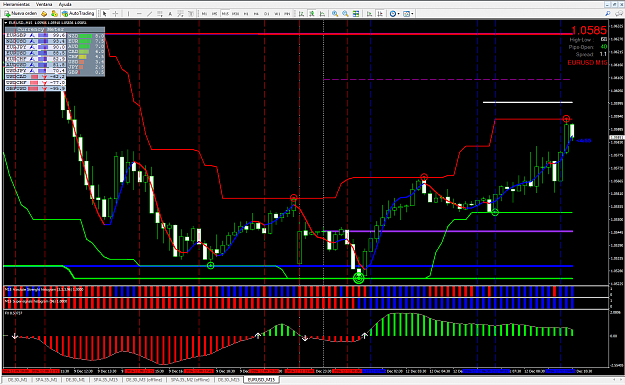
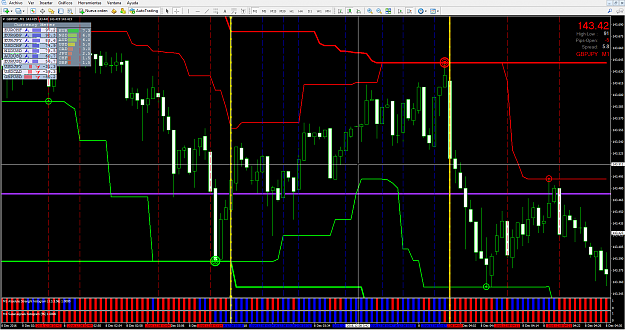
Hi all, I just posted the ASH and the SSH with the alerts option to draw vertical lines and alerts message. image Ok on the chart you can find that the best signals are when the SSH just changed colour and ASH give us his first signal, we can set ...
Trading with Super signals channel
- indalico replied Dec 6, 2016
Edition on 07/12/2016 to post new Absolute strenght histogram with vertical lines and alerts Edition on 07/12/2016 to post new Renko super signals histogram Edition on 07/12/2016 to post simple settings for double super signals channel Edition on ...
Trading with Super signals channel
- indalico replied Dec 6, 2016
Hi all, If someone is interested I have done a Super signals histogram indicator to use like a filter and the absolute strenght histogram to use like a trigger instead the 100 pips momentum indicator. If super signals histogram is blue buy on ...
100 Pips daily target, easy to use
- indalico replied Nov 30, 2016
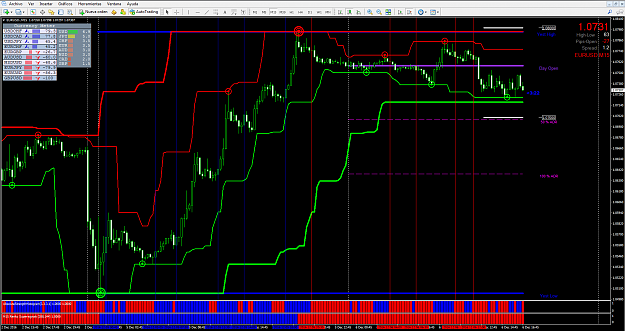
Hi all the beginners, GB use to say "you have a brain use it", Could you please explain which are the settings for the 3 trades marked on the picture? One have been opened the 9-11-2016 and closed the 29-11-2016, and the other 2 have been opened the ...
100 Pips daily target, easy to use
- indalico replied Nov 29, 2016
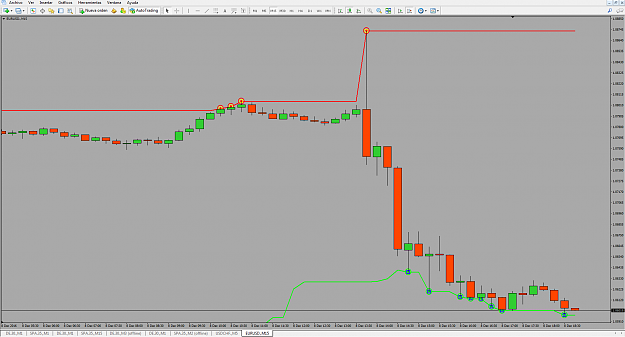
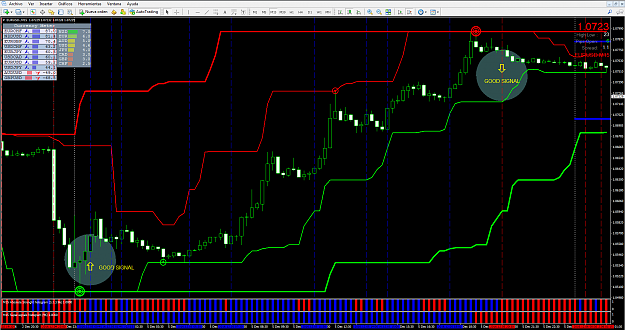
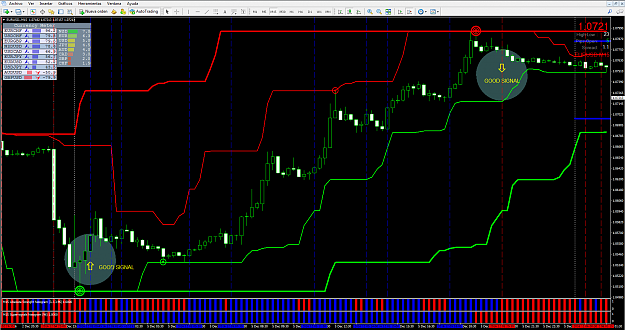
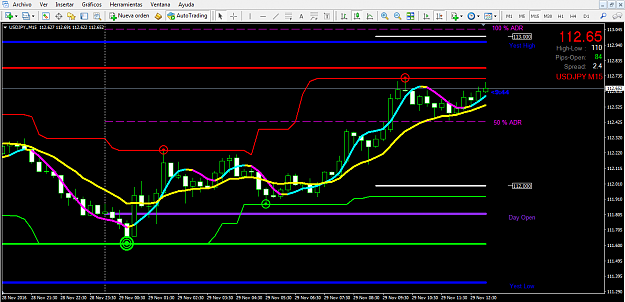
Dear friend Best2004, here you have the day open, yesterday high-low, ADR projections, and channels for manual trading. image
100 Pips daily target, easy to use
- indalico replied Nov 29, 2016
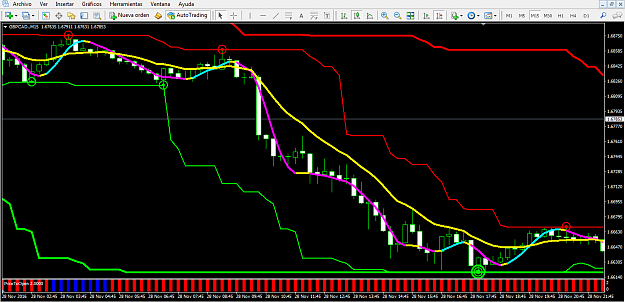
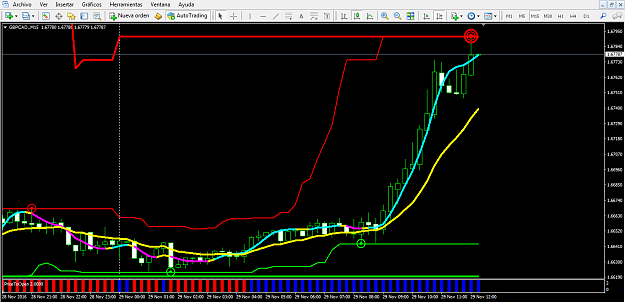
Another good filter to be used on that and any system. If the price is above the day open just look for buys and if the price is below day open just look for sellings. image image file And remeber never forgot the stop loss is better loss 10 ...
100 Pips daily target, easy to use
- indalico replied Nov 29, 2016
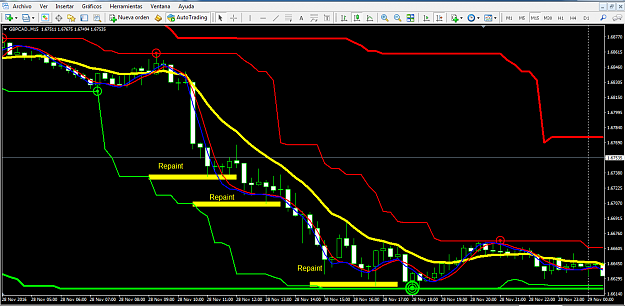
Hi all, This reply is for all not just for Abaditto. You have to understand that super signals channel is a repainting indicator because is just a high-low channel and meanwhile that new high or low is broken by the price the channel is marking the ...
100 Pips daily target, easy to use
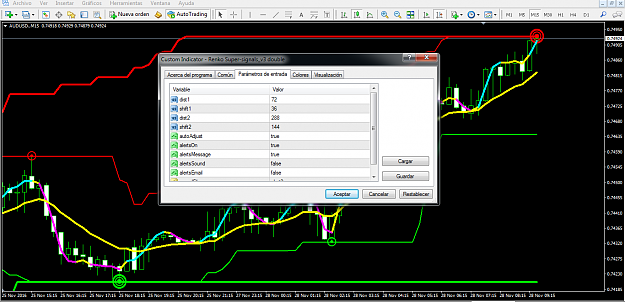
- indalico replied Nov 28, 2016
Good morning all, This post is for CsStorms, he asked me for an no autoadjustable Renko super signals double, just change the option autoadjustable to false and you can fill the settings you like, not the preadjusted for 15 and 60 minutes channels. ...
100 Pips daily target, easy to use
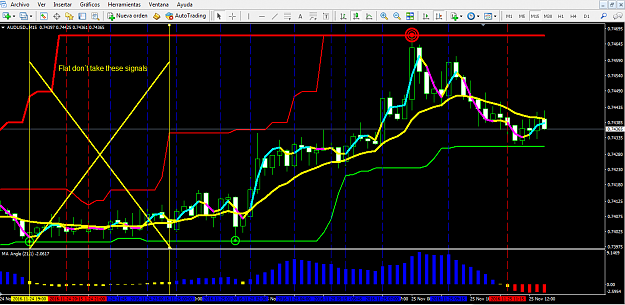
- indalico replied Nov 25, 2016
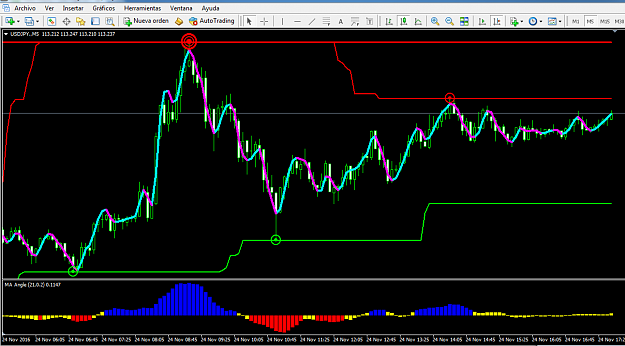
Another image with a 13 period exponential moving average in yellow. Buy on signals if evolution slope 6 periods is above the EMA Sell on signalsif evolution slope 6 periods is below the EMA Filter signals with the MA angle (21,1) Filter signals ...
100 Pips daily target, easy to use
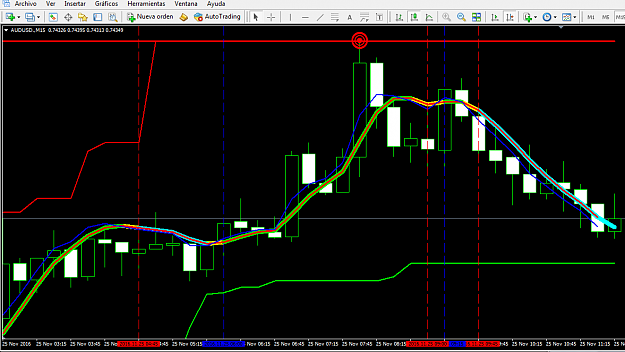
- indalico replied Nov 25, 2016
The 100 pips indicator it is just the evolution slope with same period 15 than the 100 pips indi, you can look in the image how the 100 pips indi red line is inside the evolution slope and when the blue line cross the red line the evolution slope ...
100 Pips daily target, easy to use
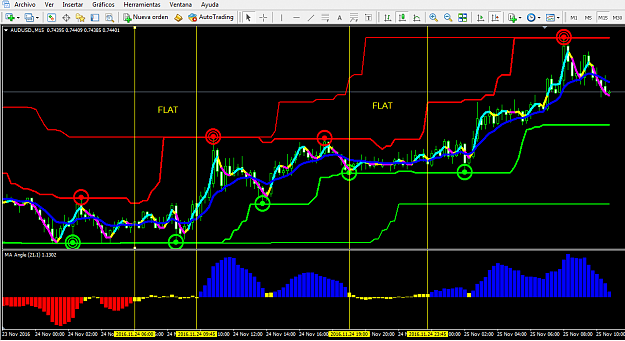
- indalico replied Nov 25, 2016
Here you have the filter. The MA angles on 15 minutes chart with settings 25 periods exponential and 1 value treshold. image
100 Pips daily target, easy to use
- indalico replied Nov 24, 2016
Hi all, A lot of people who is following the GB sytems are asking for a filter indicator, I tested the MA angle indicator on the USDJPY on 5 minutes chart and looks good to be used like a filter. The logical is when the angle of a MA is bigger than ...
100 Pips daily target, easy to use