- Search Metals Mine
- 21 Results
-
 hermanforex replied Nov 15, 2011
I Exposure Indicator download — Indicator showing youre trades and profits
XAU/USD & XAG/USD - Gold & Silver Traders Thread
- hermanforex replied Nov 15, 2011
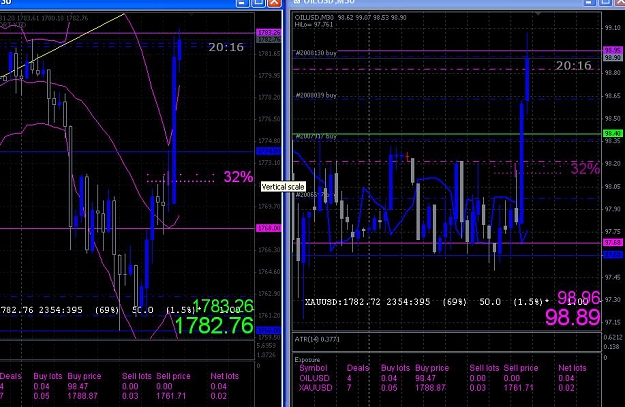
Oil and Gold is very much corelated if its right word — I started trading oil now aswell so that I dont put all my trades in one box
XAU/USD & XAG/USD - Gold & Silver Traders Thread
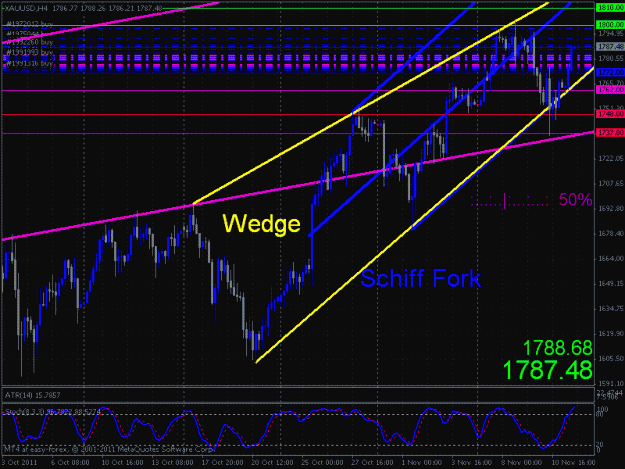
- hermanforex replied Nov 11, 2011
Check this out — Schiff fork and a H4 RISING WEDGE. make sure you have this on youre chart. Possible drop of $100+
XAU/USD & XAG/USD - Gold & Silver Traders Thread
- hermanforex replied Nov 11, 2011
Strong Resistance — Breakout below 1760 good for sell tp1 1748 tp2 1737
XAU/USD & XAG/USD - Gold & Silver Traders Thread
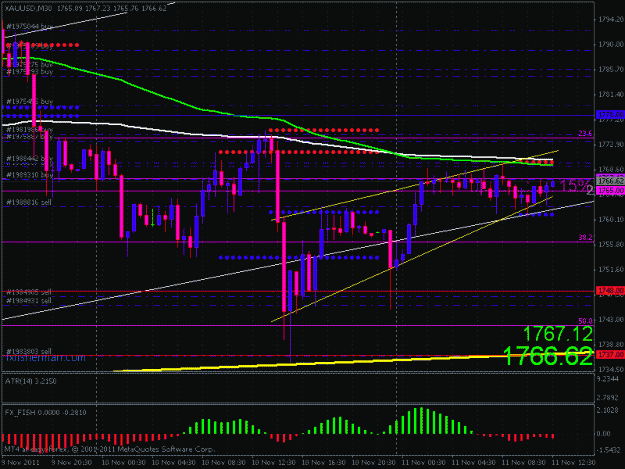
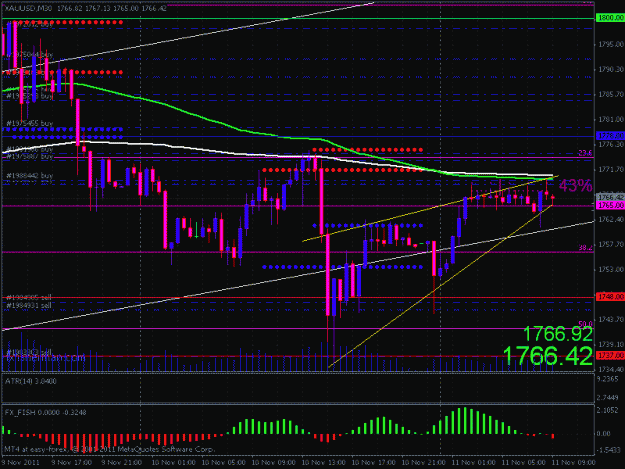
- hermanforex replied Nov 11, 2011
Rising wedge — I think Ive drawn the rising wedge incorectly the first time, there should have been a reversal already. now ive drawn it without the spikes. The breakout should still be pending
XAU/USD & XAG/USD - Gold & Silver Traders Thread
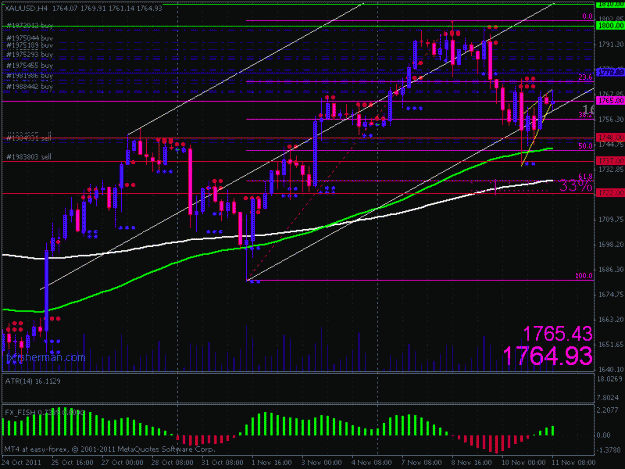
- hermanforex replied Nov 11, 2011
support — it looks like gold found strong support at the bottom of this h4 Schiff fork. If a large enough candle close far enough below this fork Im sure those bears would be happy to jump in
XAU/USD & XAG/USD - Gold & Silver Traders Thread
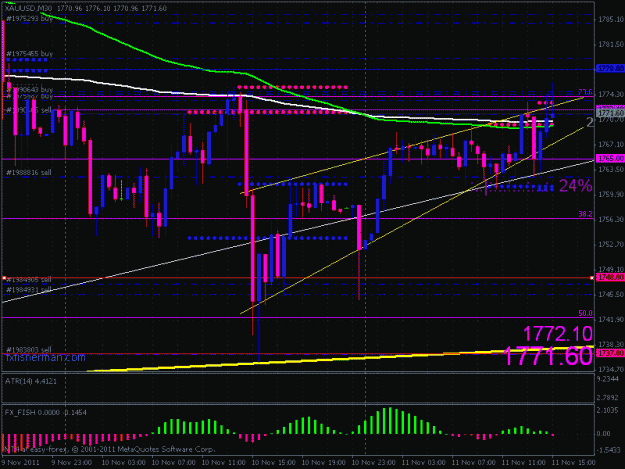
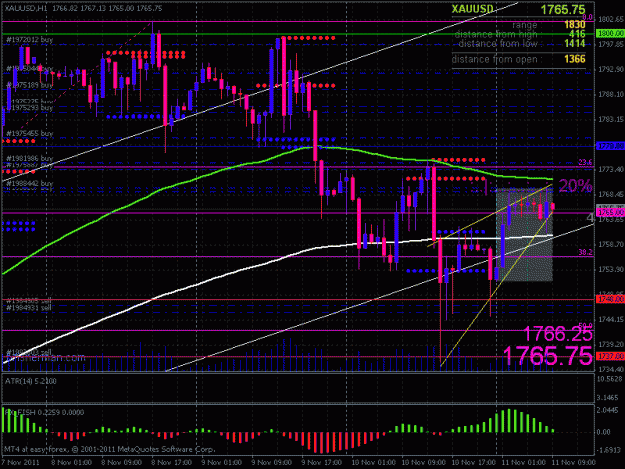
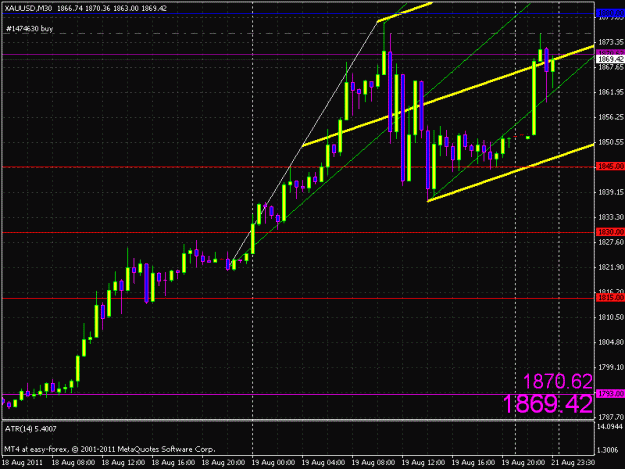
- hermanforex replied Nov 11, 2011
Rising wedge on m30 and h1 — is this a valid rising wedge? if it is I want to go short! check it out and post youre comment
XAU/USD & XAG/USD - Gold & Silver Traders Thread
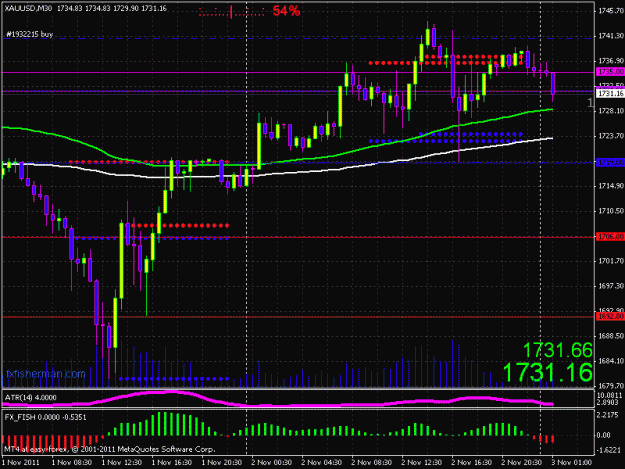
- hermanforex replied Nov 2, 2011
screenshot neckline 1727 — Im not saying gold is going to drop now it might drop down with a tp at 1719 however its 30m timeframe
XAU/USD & XAG/USD - Gold & Silver Traders Thread
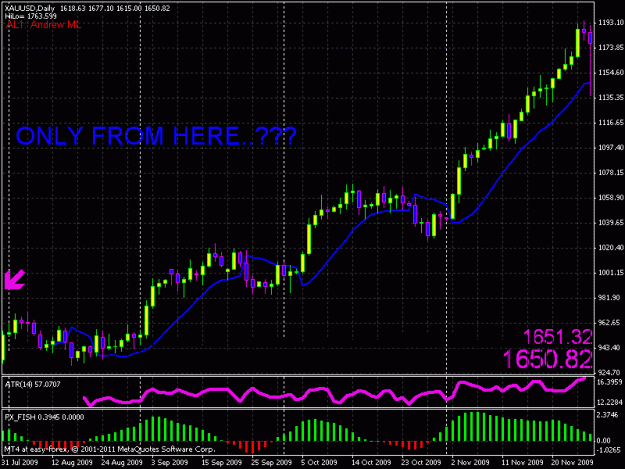
- hermanforex replied Sep 27, 2011
screenshot — Can you see the chart before 31 July 2009?
XAU/USD & XAG/USD - Gold & Silver Traders Thread
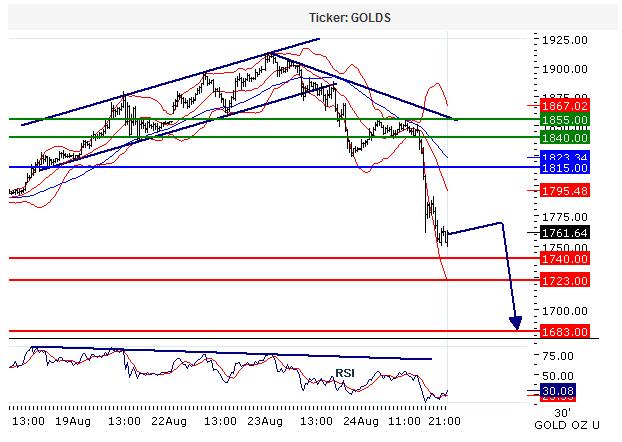
- hermanforex replied Aug 25, 2011
on my chart Resistance is as follows: R1 is at 1740 R2 is at 1760 price is above 1760 already I still have my Long postitions open. I took profits on all my shorts at once. When I saw price stopping around 1755-1767 I opened 3 short positions again. ...
XAU/USD & XAG/USD - Gold & Silver Traders Thread
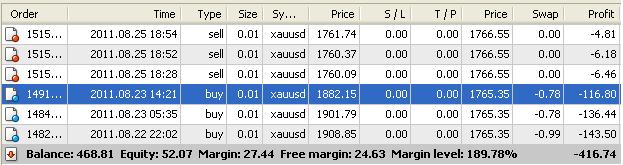
- hermanforex replied Aug 24, 2011
possible support — Im sure 1750 is a nice place for the bulls to place buy orders and for and bears takin profits(already +-$160 from record highs). Here's Trading Central's technical analasys. use at own risk ;-)
XAU/USD & XAG/USD - Gold & Silver Traders Thread
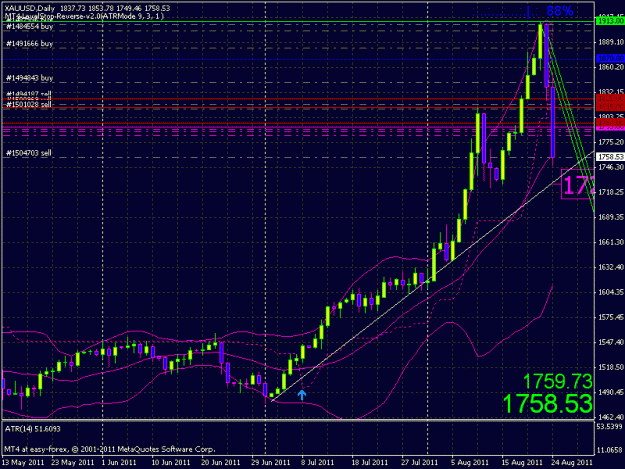
- hermanforex replied Aug 24, 2011
Is 1728 a fib level? I think price might find some support on the trend line. make youre own conclusions if its a valid line and how strong it is. on my chart 1728 is on the trendline if price is to touch the line before the open of the next dayly ...
XAU/USD & XAG/USD - Gold & Silver Traders Thread
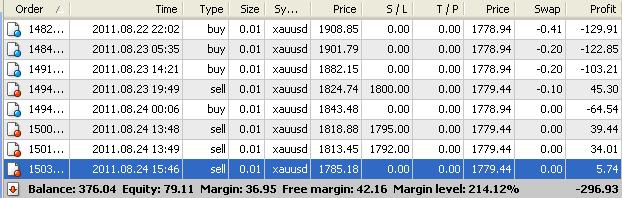
- hermanforex replied Aug 24, 2011
read explanation above
XAU/USD & XAG/USD - Gold & Silver Traders Thread
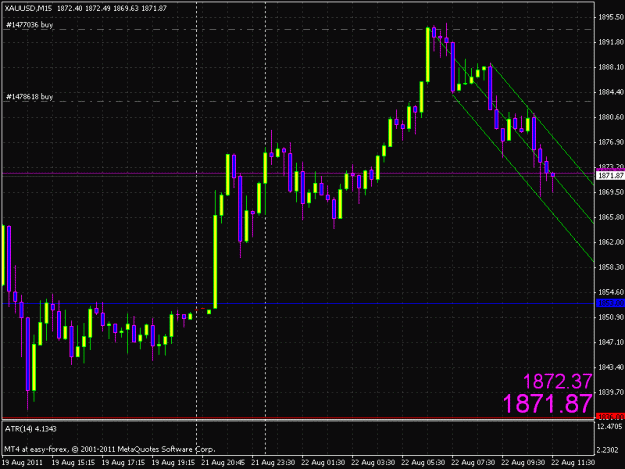
- hermanforex replied Aug 21, 2011
waiting for markets to open.
XAU/USD & XAG/USD - Gold & Silver Traders Thread
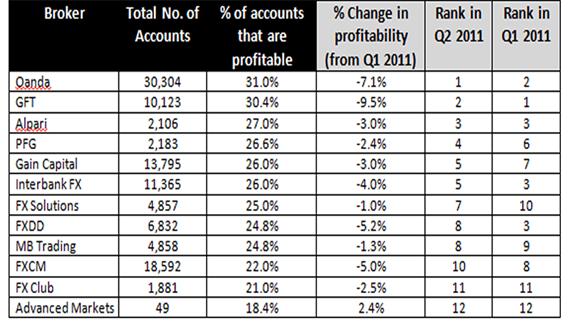
- hermanforex replied Aug 19, 2011
Chek this out! What is the overall % of profitable traders? does any of you know? I read 5% somewhere
XAU/USD & XAG/USD - Gold & Silver Traders Thread
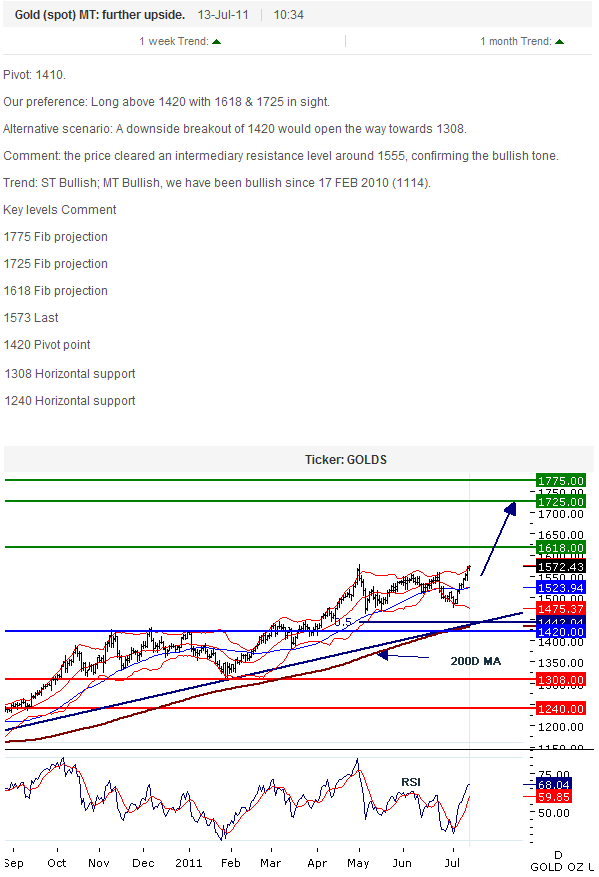
- hermanforex replied Jul 13, 2011
I just cheched it again the 1618 is a fib level
XAU/USD & XAG/USD - Gold & Silver Traders Thread
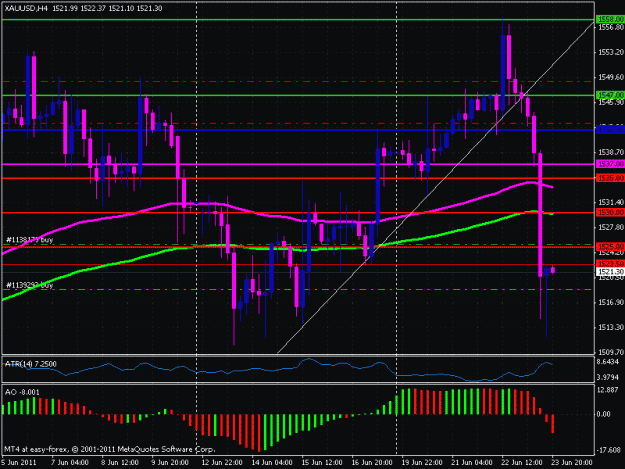
- hermanforex replied Jun 23, 2011
HAMMER!! — check out the hammer on h4
XAU/USD & XAG/USD - Gold & Silver Traders Thread