- Search Metals Mine
- 39 Results
-
 gbppip replied Aug 25, 2009
image Asia is pushing the pound down. Anyone get the drop?
Daily Scalping the Asian High and Asian Low 2 - You want simplicity?
- gbppip replied Aug 23, 2009
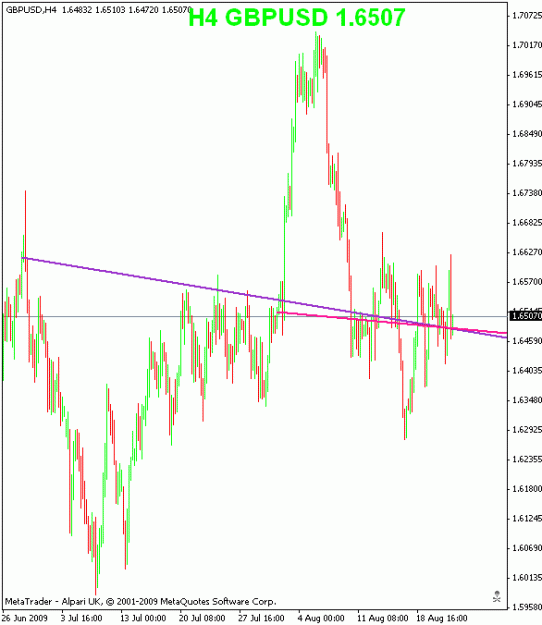
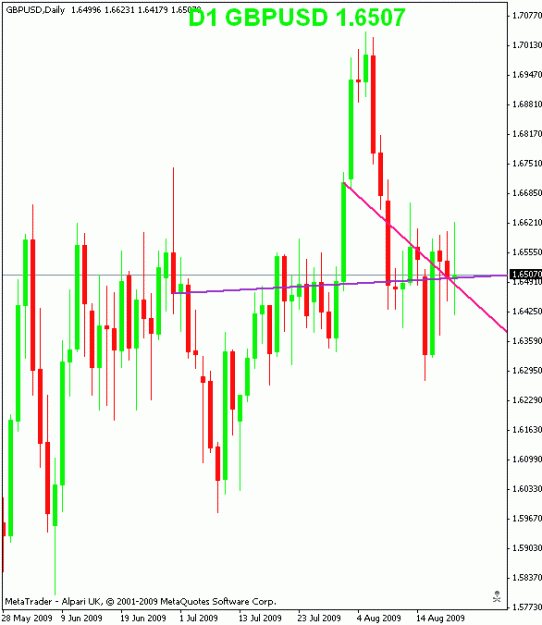
It looks like we may have had similar ideas, Mate. Have a look HERE. image Let's see if we can figure it out.
1H Cubicle Breakout System
- gbppip replied Aug 22, 2009
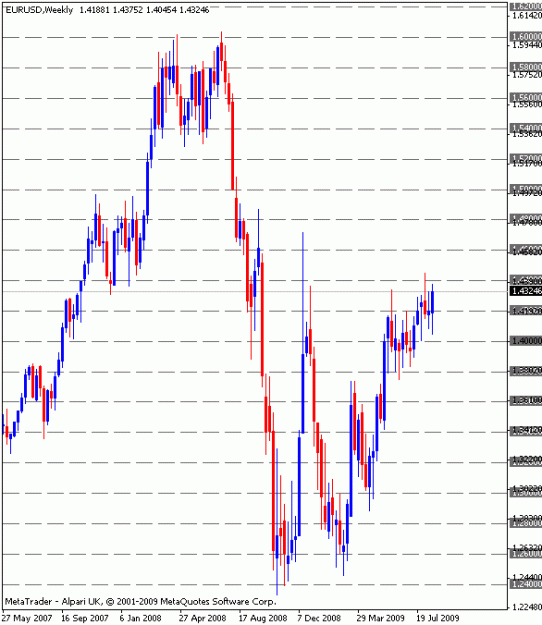
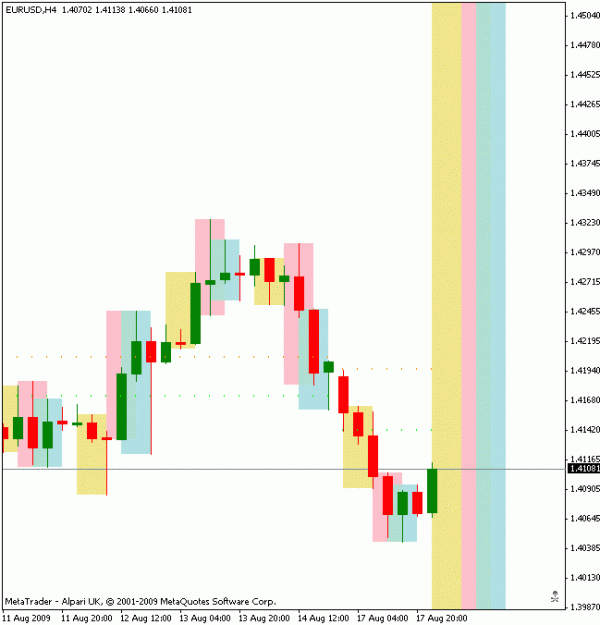
image I widened the chart to make it clearer. The last red line train stopped in the 1.4000 station. The blue line left the station at 1.4200 and ran over 100 pips before in pulled back into the station. The next blue line left the station at ...
Strat's Long Term Stress Free Trading
- gbppip replied Aug 22, 2009
image Looking at your weekly charts, I saw something similar in the M5 charts that we use - how the trains leave the station. We use 10 pips stations on the M5. I made 200 pips stations on the W1. The principle is the same. If a red line train ...
Strat's Long Term Stress Free Trading
- gbppip replied Aug 22, 2009
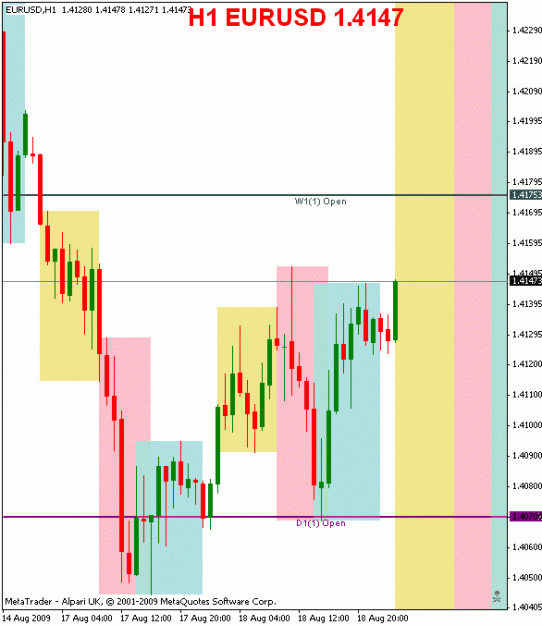
image image I drew trend-lines from the close of June and July. Pick one trend to base your decisions on. You do not need to consider time frames, it is the starting price that matters.
Congestion Entrance Price Action
- gbppip replied Aug 22, 2009
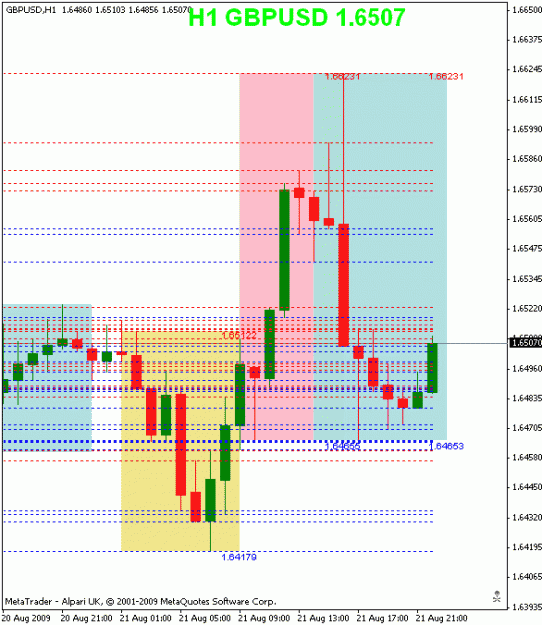
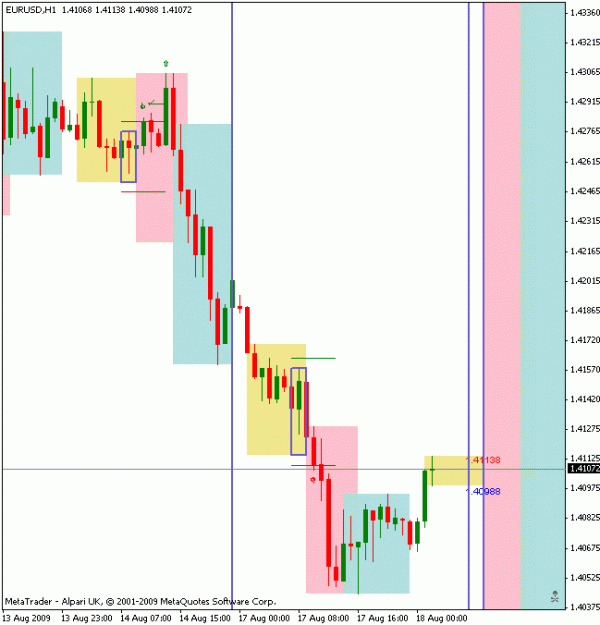
image FrankenPip gave me an idea this time. Show the high and low for the last 24 hours. Then you can see all of the "breakouts". Lots of red or blue close together would indicate strong support/resistance, don't you think? I will consider ...
Daily Scalping the Asian High and Asian Low 2 - You want simplicity?
- gbppip replied Aug 20, 2009
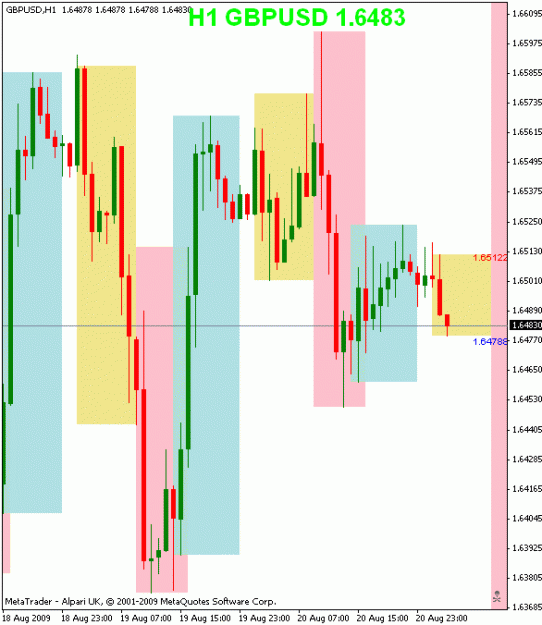
image I collected some pips on the GBPUSD short.
Daily Scalping the Asian High and Asian Low 2 - You want simplicity?
- gbppip replied Aug 18, 2009
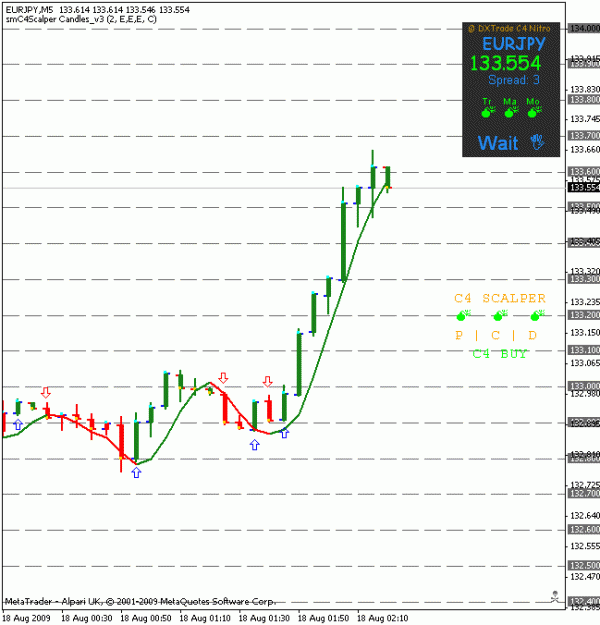
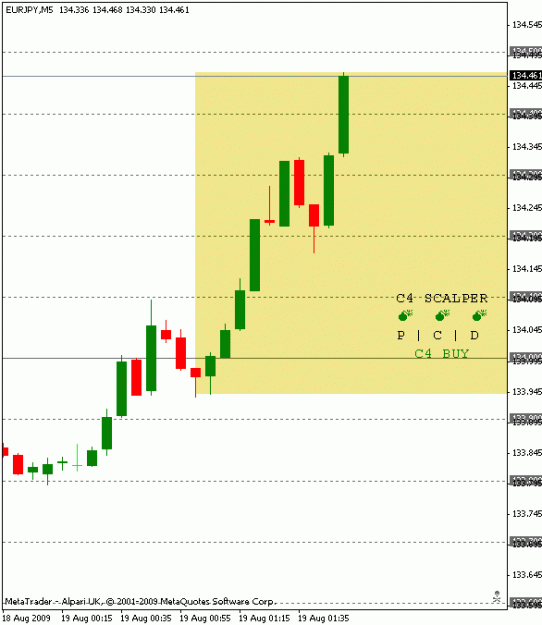
image Sorry Mate, but I am really confused. I'll let it go. You have more important stuff to do. Thanks, Mate. How I played the chart was to go long at 133.70 and exit at 133.75. Then the Nitro_Momentum green arrow appeared. I will now use that as ...
C4 Scalping
- gbppip replied Aug 18, 2009
image DXTrade: While I have your attention, your DX Trade Nitro Swithboard just popped up a "buy" alert with all the bombs red. Maybe the messages need to be reversed?
C4 Scalping
- gbppip replied Aug 18, 2009
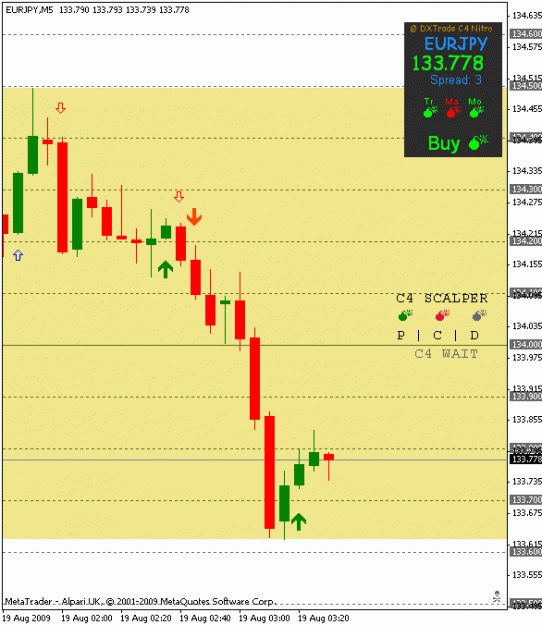
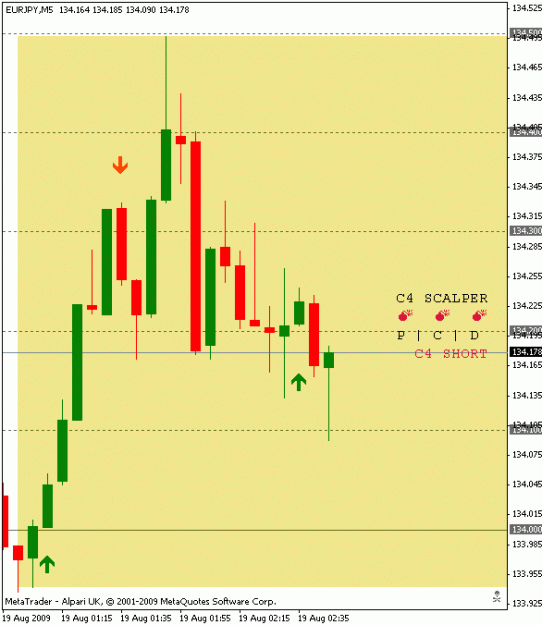
image Happy ending, Mate. Everyone got their 5 pips.
C4 Scalping Do you notice the red arrow "disappeared"? This is what I was asking about a few posts ago.
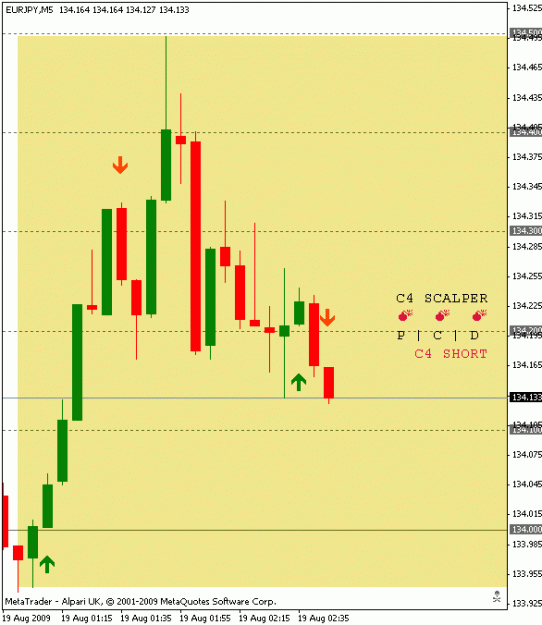
- gbppip replied Aug 18, 2009
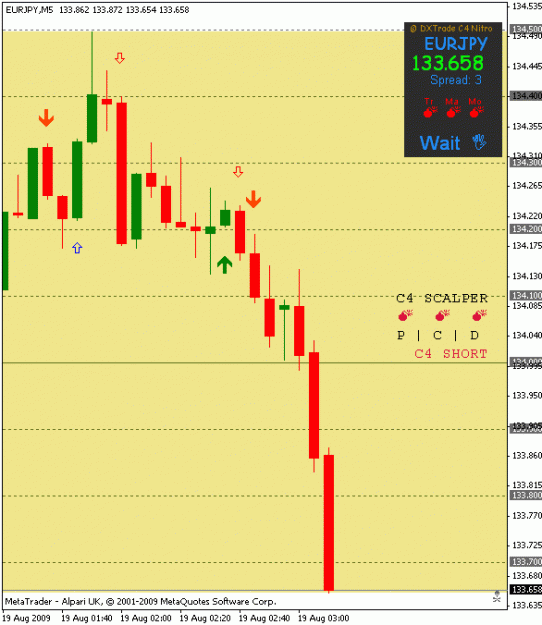
image Short signal on "bomb meter" and Nitro-Momentum. However, the red train left the station before those signals and I was getting off the train with my 5 pips when the others were getting on.
C4 Scalping
- gbppip replied Aug 18, 2009
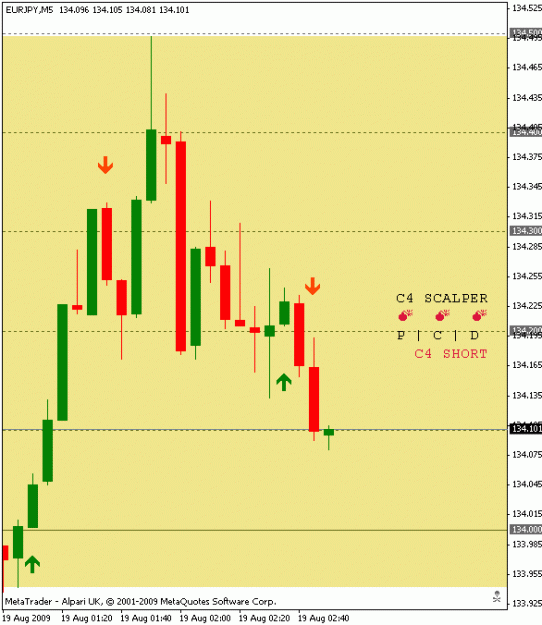
image I changed the colors and made the arrows bigger. But the "P" on the bomb meter has momentum so I don't know if I will need more indicators. Need to keep things simple as possible, Mate.
C4 Scalping
- gbppip replied Aug 18, 2009
image I looked in the attachments section. Maybe I got an old version? But it's only a day old, Mate.
C4 Scalping
- gbppip replied Aug 18, 2009
image Can't seem to get the hang of Renko blocks. Instead, lines every 10 pips with the "bomb meter" is proving to be profitable. Simple, no thought, 3 bombs of the same color, push the plunger, collect the pips. Thanks again, Edgetrader.
C4 Scalping
- gbppip replied Aug 18, 2009
image There is one on FF CLICK HERE
Daily Scalping the Asian High and Asian Low 2 - You want simplicity?
- gbppip replied Aug 17, 2009
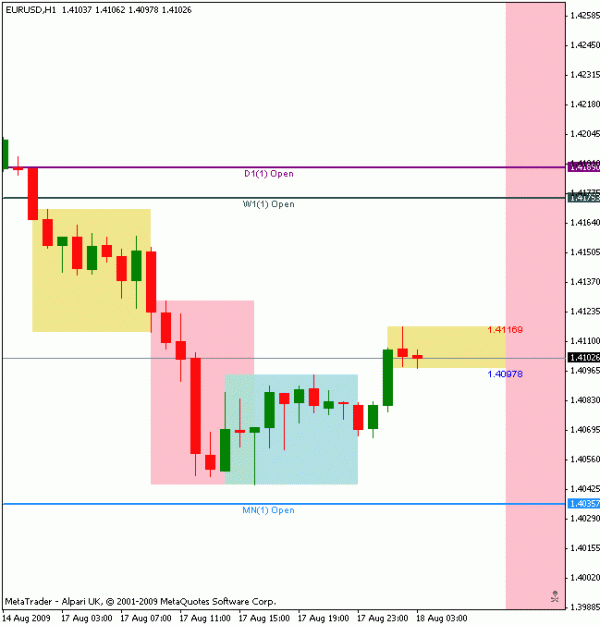
image I believe FrankenPip is telling you that the chart period does not matter. Use a date/time to get your reference price. Is the current price above or below your reference price? Examples: Weekly open price. Monthly open price. Daily open ...
Congestion Entrance Price Action
- gbppip replied Aug 17, 2009
image Looks good, Mate. Very much like my setup.
0400-0700 GMT Breakout Strategy
- gbppip replied Aug 17, 2009
image I have been thinking more on this Renko chart. If you move the sweetspot gold lines to whatever offset you want, wouldn't that be the same as renko blocks? I mean you can watch price go from one block to the next. Wouldn't a Renko chart show ...
C4 Scalping