- Search Metals Mine
- 7 Results
-
 fxonuoha replied Jun 16, 2020
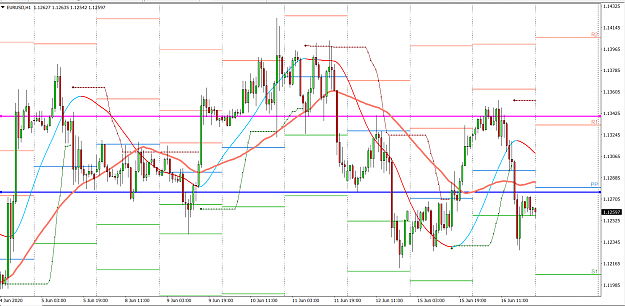
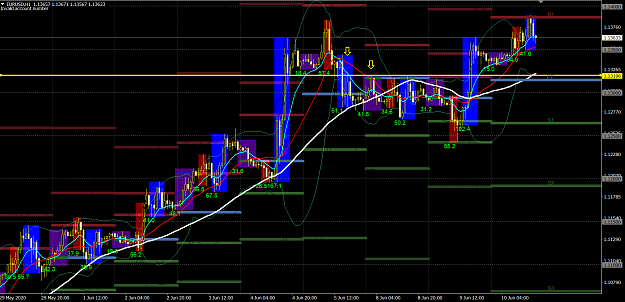
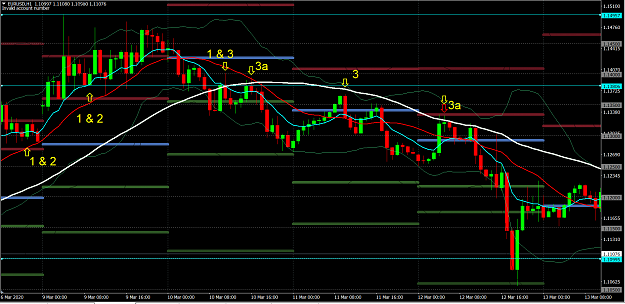
The pink line is the top of a larger range. 5 is a retrace to the edge of another channel which price broke through and also the retrace to the 50.
Gejordan Weekly Journal
- fxonuoha replied Jun 16, 2020
yes. I see 5 as a retrace to 50sma which failed and 6 as a retrace entry to the edge of the channel (3) for long entry.
Gejordan Weekly Journal
- fxonuoha replied Jun 16, 2020
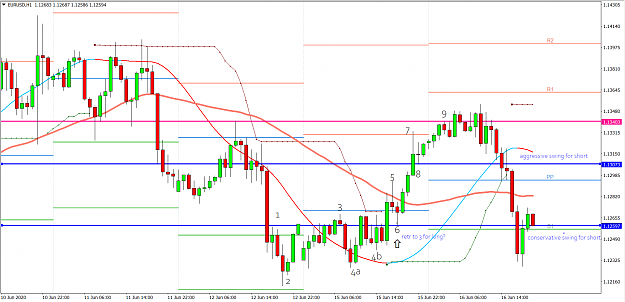
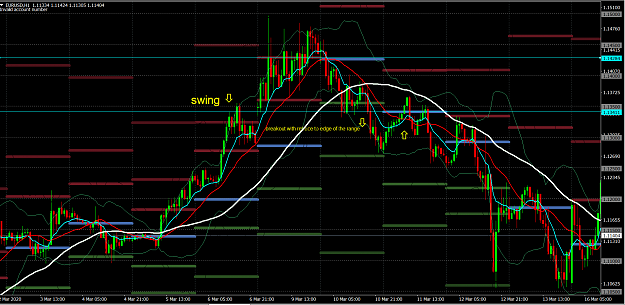
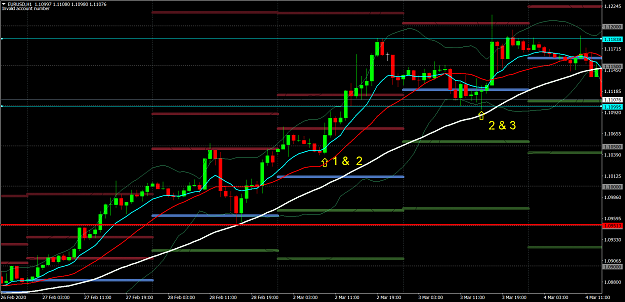
Hello sir Rearden I am trying to understand this chart. (1) is lower high. (2) is higher high (because it closed above previous high (1) and stayed above i.e at least another candle closed above (1)) (3) is higher high ( just for same reason as (2)) ...
Gejordan Weekly Journal
- fxonuoha replied Jun 11, 2020
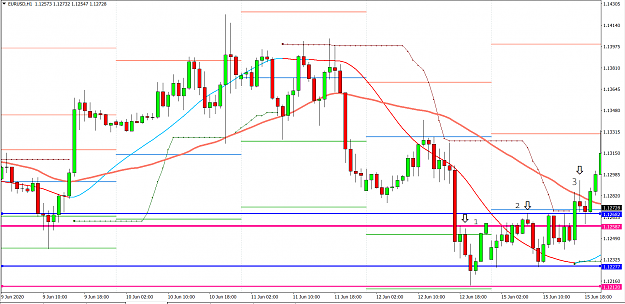
At present price is in a channel between 1 and 2. Price broke through 3 but could not stay under ( if our bias were long we would have entered on a retrace to the 50sma here 3a).Sine our bias is short, I'll be looking for price to break through 1 ...
Gejordan Weekly Journal
- fxonuoha replied Jun 10, 2020
Hello sir, I saw the saw price breaking the yellow line which was the swing low from late last week but I didn't take the trade. Price came down and stayed below the yellow line with a retrace , forming a bearish engulfing candle (second yellow ...
Gejordan Weekly Journal
- fxonuoha replied Jun 1, 2020
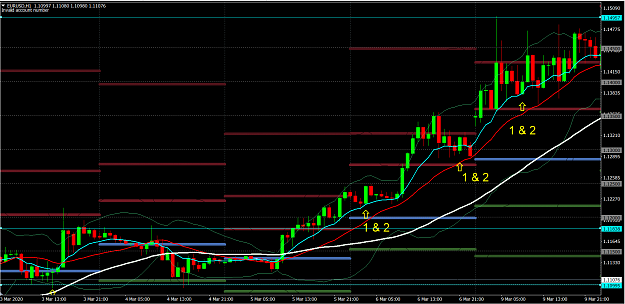
Hello Ge, apart from being close to the pivot for that day, 1.330 is the last swing of the 6th and forms the bottom of the range from which price broke out from.
Gejordan Weekly Journal
- fxonuoha replied May 31, 2020
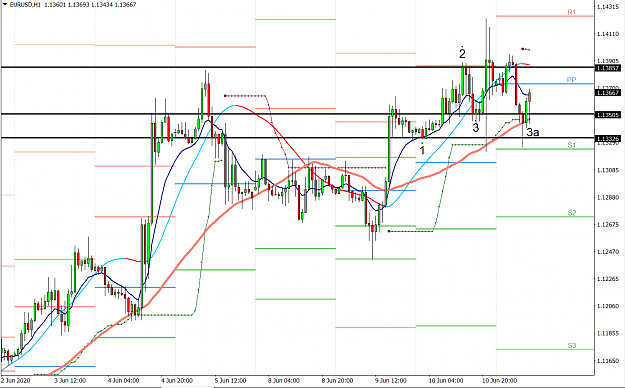
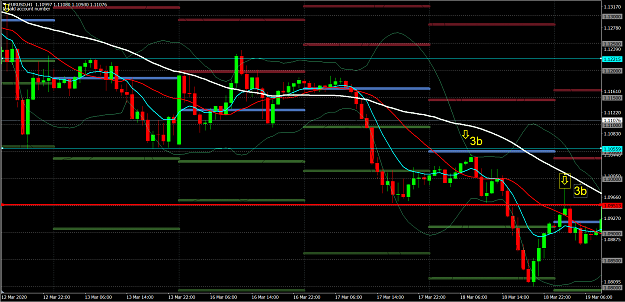
Hello everyone, I marked areas of possible trades based on bias for the respective weeks. ( 3a= pb to 50sma : 3b= pb to edge of range)
Gejordan Weekly Journal
- Posts by Member Search: 'fxonuoha'