- Search Metals Mine
- 12 Results (1 Thread , 11 Replies )
- fxke62 replied Jul 8, 2022
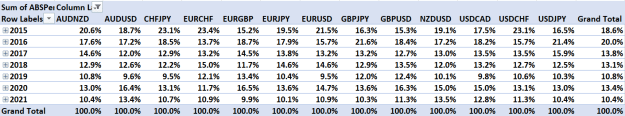
Was curious about volatility patterns within a year for EU, then expanded my research further. In short, over the years volatility in EU (and the market as a whole) has gone down substantially as you can see in the table below. Volatility is ...
Trading EURUSD only
- Set the right Stop LossStarted Jan 31, 2021|Trading Discussion|6 replies
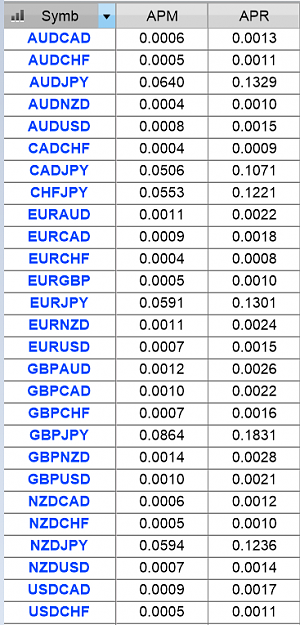
This will save you a lot of time to set the right Stop Loss and plan your trade better. The data is ...
- fxke62 replied Jan 13, 2021
Stop-outs on GBP...it doesn't surprise me. I write many programs to analyze price data - it helps my trading a lot. One of them analyzes pairs on 3 risk factors, of which one is direction changes. GBPCAD and GBPNZD are top of the risk pyramid almost ...
Soul's Thread

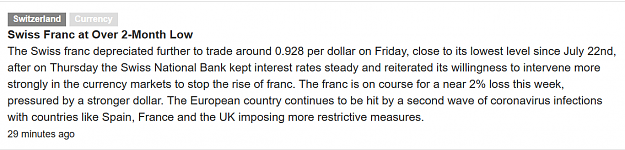
- fxke62 replied Oct 29, 2020
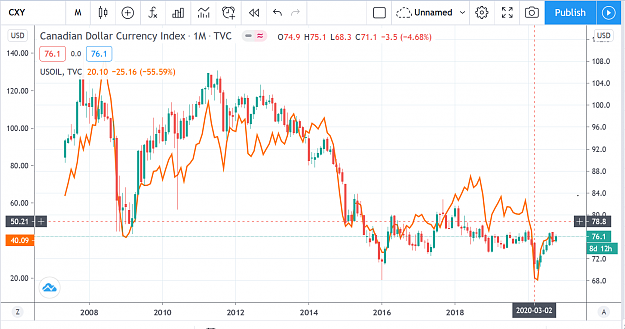
I checked the common wisdom that CAD follows the oil price. That seems to be true often (and then with near 100% correlation), but from half 2016 to early 2020 that wasn't the case. I don't follow oil that long yet. Is there any oil-side explanation ...
Crude Oil
- fxke62 replied Oct 29, 2020
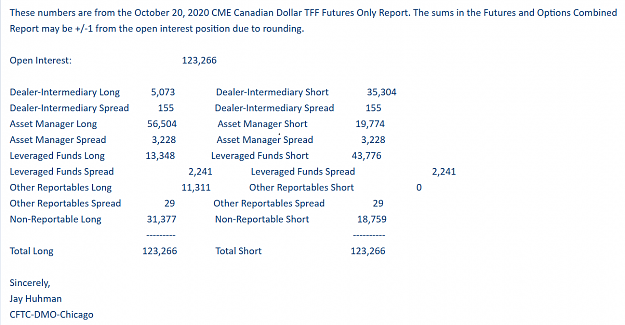
I didn't fully understand how the CFTC calculates the Total Long and Total Short, because it does not match with the total of the individual long- and short positions. So I send them a message. Same day reply with explanation. Great service - kudos! ...
Follow the Smart Money / COT Analysis
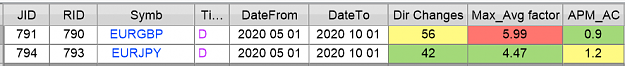
- fxke62 replied Oct 29, 2020
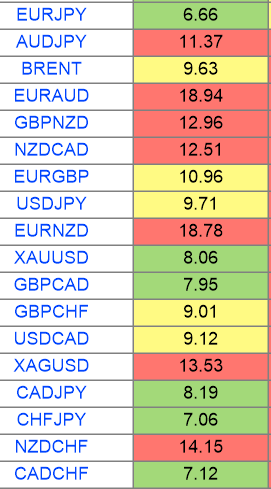
What moves how fast you can see here (from my own trading database). Period is taken over the last 5 months to stay out of the early covid months. Timeframe Daily. EURJPY is obviously more steady (33% difference - green is low risk). Max Avg Factor ...
EURJPY | Market Footprint Chart
- fxke62 replied Sep 25, 2020
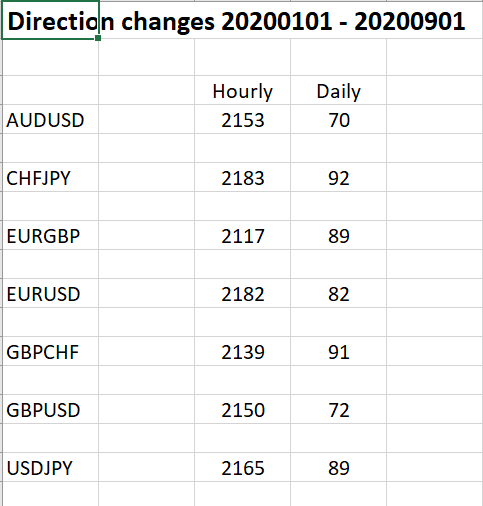
GU is a good pair for trading longer time frames also: it doesn't flip so often as others. Here you see some popular pairs and the number of direction changes on both Hourly and Daily. GU is in low in the pack. Note there is no meaningful difference ...
Cable Update (GBPUSD)
- fxke62 replied Sep 25, 2020
Ever wondered in what you have the best chances trading? Then an important question is which pair changes direction less often. Here you see some popular pairs and the number of direction changes on both Hourly and Daily. EURUSD is in the middle of ...
EURUSD

- fxke62 replied Sep 10, 2020
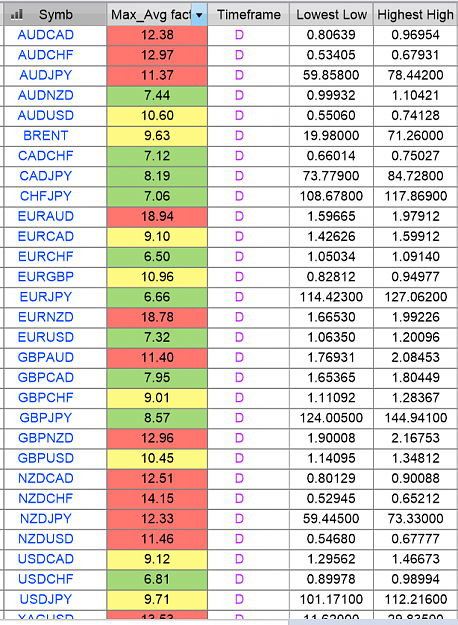
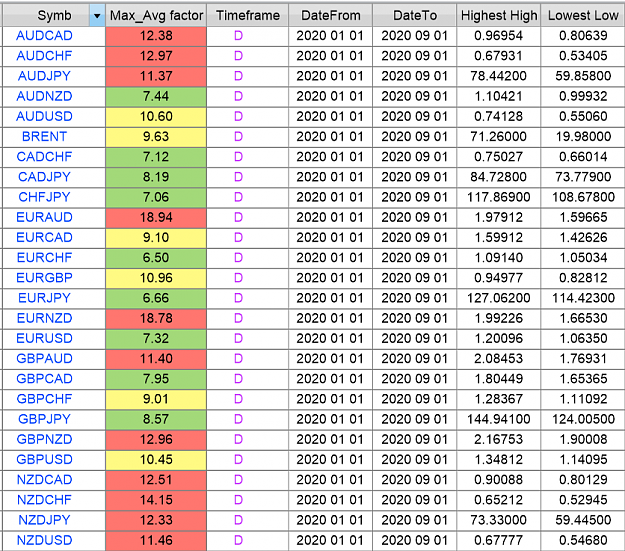
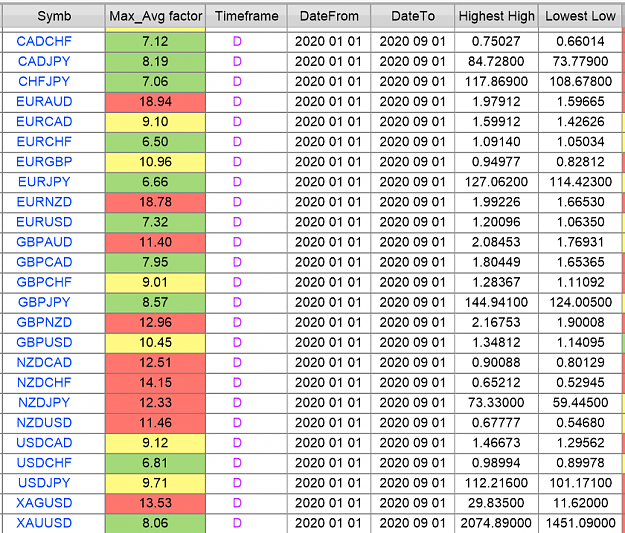
@NTK: he doesn't show ADR in this table (only in the details per pair). But his might at least be a little useful too.. the max ranges within which the pairs have moved (LL and HH): (20200101 - 20200901)
What FX market do you prefer to trade now-a-days?
- fxke62 replied Sep 8, 2020
I have invented that ratio myself, but most probably others will have too. I am not into indicators so I don't know if it exists as an indicator. How you should treat it: first and foremost decide what the best trades are according to your charts ...
What FX market do you prefer to trade now-a-days?
- fxke62 replied Sep 8, 2020
ADR gives you an idea how much a pair moves in a day (for risk mgmt / SL). I always calculate the ADR against the MaxDR (just look back on the chart over a period you choose). The larger the number MaxDR/ADR, the more risk a pair is (wild swings ...
What FX market do you prefer to trade now-a-days?
- Posts by Member Search: 'fxke62'